

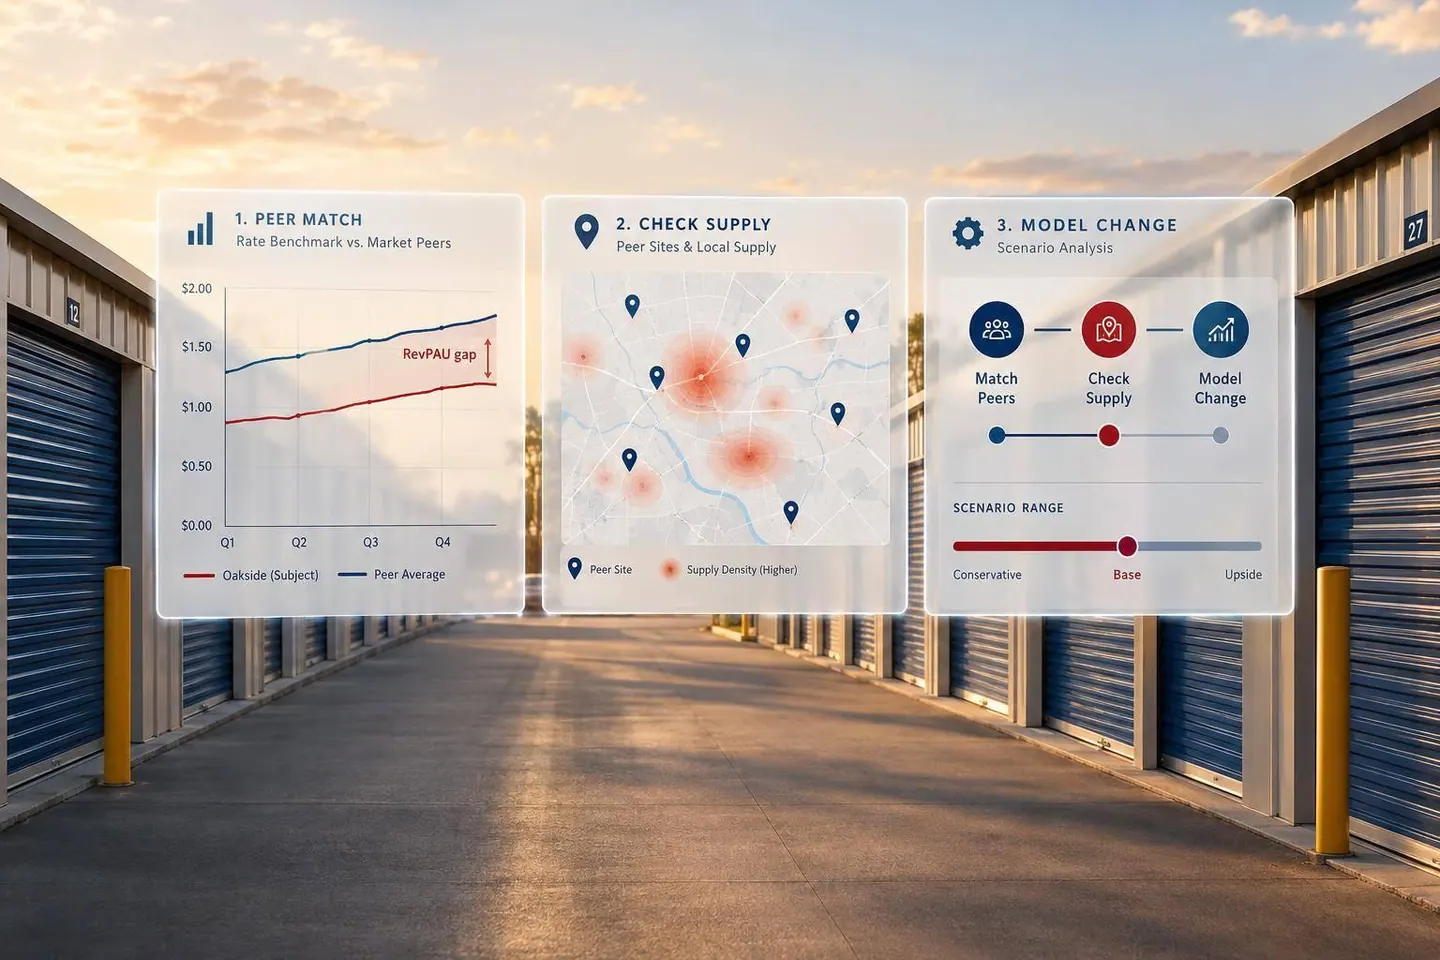
I start with collected rent - not advertised prices - to compare self-storage performance. Divide monthly rental collections by average rentable units, including vacant units, to calculate revenue per available unit (RevPAU).
The market figures need context. In the cited national same-store sample, Q2 2025 revenue fell 0.3% from Q1, while average occupancy reached 91.8%. Those figures help explain performance; they are not direct RevPAU benchmarks or current October 2026 rates.
Here’s how I use this study to assess a property:
- Match the numbers: Use the same periods, revenue rules, and property sets.
- Match the peers: Compare local properties by unit size, climate control, access, and storage type.
- Check supply: Review nearby openings, expansions, conversions, and closures.
- Test the decision: Model base, downside, and supply-pressure cases before changing pricing or valuation assumptions.
My takeaway: <u>a benchmark gap is a reason to investigate - not an automatic reason to change rents.</u> Local comparisons and property-level cash flow should guide the next step. This data is also vital when preparing for a sale.
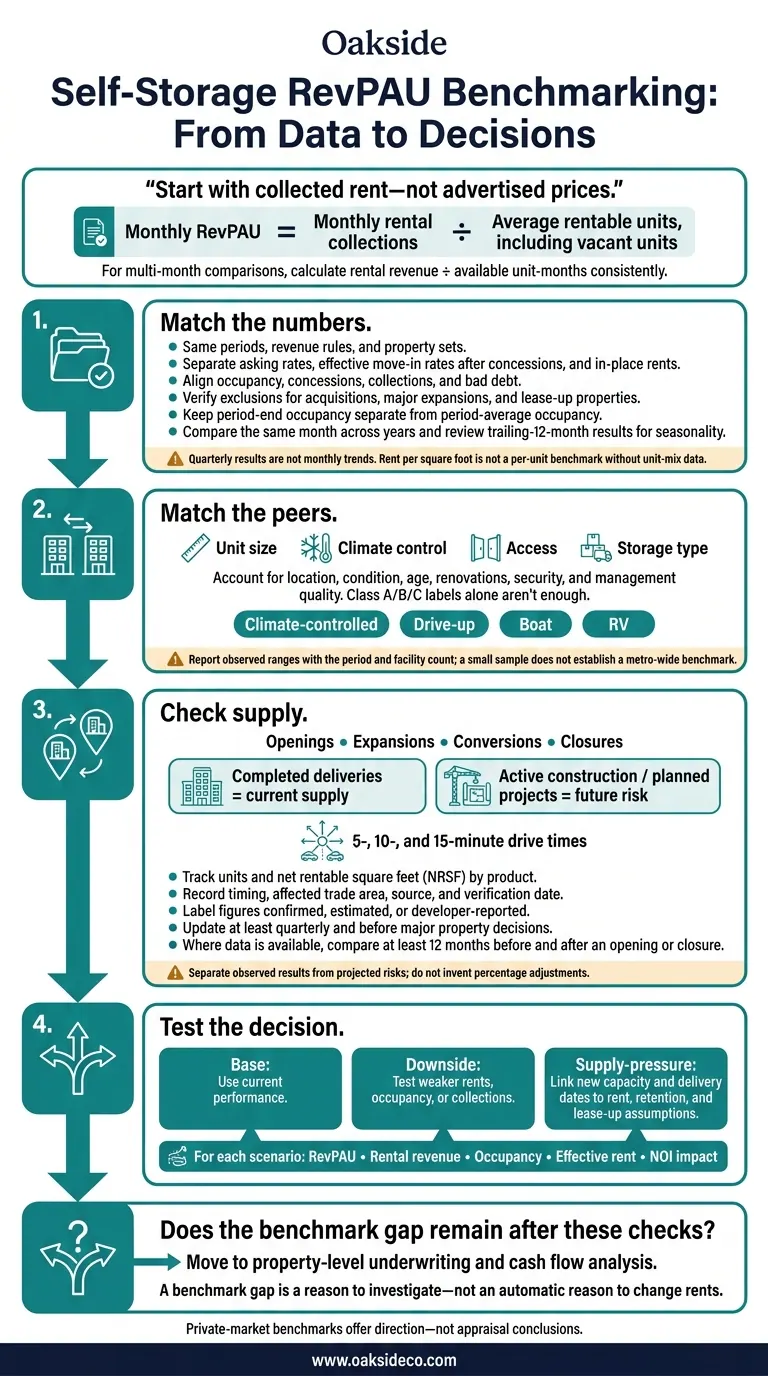
Self-Storage RevPAU Benchmarking: From Data to Decisions
The sources provide quarterly and annual comparisons - not a full monthly same-store series. Report month-over-month and year-over-year changes for the same property set when data is available. Do not treat quarterly results as monthly trends.
These summaries do not report RevPAU directly. The table separates the operating inputs that drive it.
| Reporting period | Reported operating trends |
|---|---|
| National same-store sample, Q2 2025 vs. Q1 2025 | Revenue fell 0.3%; realized rent growth was flat; occupancy averaged 91.8%, down 40 basis points. |
| Public Storage, nine months ended September 30, 2025 vs. 2024 | Realized rent per occupied square foot increased; same-store revenue rose 0.1% ($2.8 million) despite lower occupancy. |
These figures help explain changes in achieved rate per available unit. They are inputs to RevPAU benchmarking, not direct benchmarks.
Separate Pricing, Vacancy, and Collection Effects
Report asking rates, effective move-in rates after concessions, and in-place rents separately. Asking rates affect leasing, while concessions, turnover, and delinquency determine collected revenue.
To explain changes, check concession records, tenant-level increases, move-ins and move-outs, unit mix, and delinquency. Asking-rate movements alone do not tell the whole story.
Check Same-Store Sample Consistency
Before combining results, verify that each source follows the same same-store rules. Without matching rules, occupancy and revenue changes cannot support like-for-like RevPAU comparisons.
Check whether sources exclude acquisitions, major expansions, and lease-up properties. Flag inventory changes, and disclose property counts, unit counts, and weighting. Make clear whether results use simple property averages or unit-weighted averages.
Treat cited changes as nominal, not inflation-adjusted. Compare the same month across years and review trailing-12-month results to account for seasonality. Keep period-end occupancy separate from period-average occupancy. Do not convert rent per square foot into per-unit benchmarks without unit-mix data.
Judge achieved RevPAU against matched local peers. This review offers directional market evidence - not verified benchmark bands by metro or facility class.
Compare Metros and Submarkets
The Q1 2025 discussion points to these market patterns:
| Metro | Directional result | Supply note |
|---|---|---|
| Chicago and New York City | Outperformed | No supply explanation supplied |
| Atlanta and Phoenix | Softer demand | Elevated supply |
These differences are directional only. Next, check whether local supply helps explain them.
For property-level analysis, report only observed ranges, along with the period and facility count. A small sample offers direction; it doesn't establish a metro-wide benchmark.
Compare Facility Classes and Unit Features
Compare matched units, not broad product labels. Class A/B/C labels alone aren't enough. Group properties by climate control, access type, unit size, and storage product when comparing achieved RevPAU.
| Attribute group | Matching criteria | Comparison limits |
|---|---|---|
| Climate-controlled storage | Climate control, unit size, interior access | Match location, condition, age, and renovations; don't assume a fixed premium. |
| Drive-up storage | Drive-up access and matching unit sizes | Account for security, condition, and management quality. |
| Boat storage | Storage product and space dimensions | Keep separate from standard storage because land use, access needs, and revenue structures differ. |
| RV storage | Storage product and space dimensions | Compare self-storage vs RV storage investment returns separately, accounting for seasonal demand and revenue structures. |
Use the 20%–40% climate-control premium as an outside reference, then test it against matched local comps. Changes in local supply can widen or narrow these benchmark gaps.
A historical benchmark can lag behind changes in its trade area. Supply changes affect both the level and reliability of achieved-rate benchmarks. Track deliveries, expansions, conversions, and closures separately. Completed deliveries count as current supply; active construction remains a future risk until its effects can be measured. Supply pressure often varies by trade area, so assess the local area rather than relying only on metro-level pipeline totals. Run these checks before treating a historical benchmark range as current.
Track Inventory and Supply Changes
Track unit counts and net rentable square feet (NRSF) consistently. Label each figure as confirmed, estimated, or developer-reported. Keep climate-controlled, drive-up, boat, and RV inventory separate so you aren't comparing unlike products. Update records at least quarterly and before refinancing, acquisition, disposition, or annual budgeting decisions.
| Supply item | Capacity and status to record | Timing and affected trade area | Potential benchmark effect | Source and verification record |
|---|---|---|---|---|
| Current inventory and capacity additions | Operating units and NRSF by product; separate completed deliveries, active construction, and added expansion capacity | Actual or expected opening dates, including phases; overlapping drive-time area | Completed additions establish current supply; construction points to future lease-up pressure; expansions may affect only certain sizes or features | Property records, permits, site checks, and occupancy approvals; record verification date |
| Announced or planned projects | Proposed units and NRSF; separate approved projects from concepts | Estimated opening or uncertain timing; proposed service area | Future risk, not current supply | Planning filings and owner confirmation; record verification date |
| Conversions | Capacity added or removed, by product | Confirmed or expected change-of-use date; accessible trade area | Changes supply and product mix; access or layout may limit overlap | Change-of-use records and occupancy approvals; record verification date |
| Closures | Units and NRSF removed; temporary or permanent | Closure date; likely tenant relocation area | May tighten supply if displaced demand stays nearby | Closure notice, property records, site inspection; record verification date |
Assess Trade-Area Exposure
Trade-area boundaries determine whether a supply change affects the benchmark. Map 5-, 10-, and 15-minute drive times, then check actual roads, congestion, bridges, rail lines, and other barriers. A straight-line radius may include facilities that customers can't conveniently reach. Boat and RV storage may draw customers from a larger area than household storage, so set boundaries by product.
Track promotions, asking rates, occupancy, concessions, and collected revenue by unit type. Temporary discounts can broaden benchmark ranges without resetting the market rate. Expansions that serve different unit sizes may have little effect.
Separate observed results from projected risks. Where data is available, compare at least 12 months before and after an opening or closure. Account for seasonality, demand, pricing decisions, and collections. Without post-event evidence, use supply scenarios - not an unsupported percentage adjustment. A closure may not lift rates if displaced tenants leave the trade area.
After comparing same-store trends, metro differences, and facility-class peers, check local supply changes to see whether a benchmark still fits. Private-market benchmarks offer direction - not appraisal conclusions.
Owner Review Checklist
Before changing pricing, valuation, or acquisition assumptions, confirm that periods, revenue definitions, occupancy, concessions, collections, and bad debt align. Calculate rental revenue divided by available unit-months the same way across comparisons. Review peer selection, trade-area conditions, and incoming supply, then document sources, exclusions, and assumptions.
Test three clearly labeled scenarios:
- Base: Use current performance.
- Downside: Test weaker rents, occupancy, or collections.
- Supply-pressure: Link new capacity and delivery dates to rent, retention, and lease-up assumptions.
For each scenario, show RevPAU, rental revenue, occupancy, effective rent, and NOI impact.
If the benchmark gap remains after these checks, move to property-level underwriting.
Use Property-Specific Transaction Analysis
A benchmark gap calls for investigation - not an automatic rent increase, valuation adjustment, or blanket portfolio change. Review unit availability, renewals, delinquency, condition, and costs to maximize NOI. Back any proposed change with property-level cash flow analysis and the three scenarios above.
Oakside Co, a national commercial real estate advisory firm specializing in self-storage and boat & RV assets, provides data-driven, investment-banking-level analysis. The firm serves as an advisory resource for property and transaction decisions.
How can I benchmark RevPAU with limited local data?
Benchmark Revenue per Available Unit (RevPAU) against verified facility data - not anecdotes. To gauge demand, review physical and economic occupancy, lease-up rates, and asking rents versus achieved rents.
Compare 5 to 10 recent comparable sales using trailing-12-month net operating income. Focus on properties within a 1- to 3-mile radius in urban areas or a 5-mile radius in suburban or rural areas. Use standardized expenses and verified rent rolls.
How do I separate seasonal weakness from supply pressure?
Review 24 to 36 months of data, rather than judging a single month. Seasonal slowdowns tend to follow a predictable pattern: winter demand softens, then recovers as leasing picks up from March through August.
Supply pressure is more likely when performance stays weak during peak leasing season. Watch for aggressive discounts that persist, move-ins that fail to recover, street rates below prior-year peaks, or heavy concessions that widen the gap between physical and economic occupancy.
When should a RevPAU gap change my pricing strategy?
Adjust your pricing when a RevPAU gap suggests you’re filling units at the expense of revenue growth - or signals deeper demand issues. If physical occupancy stays high while street rates fall, you’re likely giving up rate growth to keep units occupied.
Track performance closely and review 24 to 36 months of data to tell whether you’re seeing a seasonal dip or a structural demand problem.