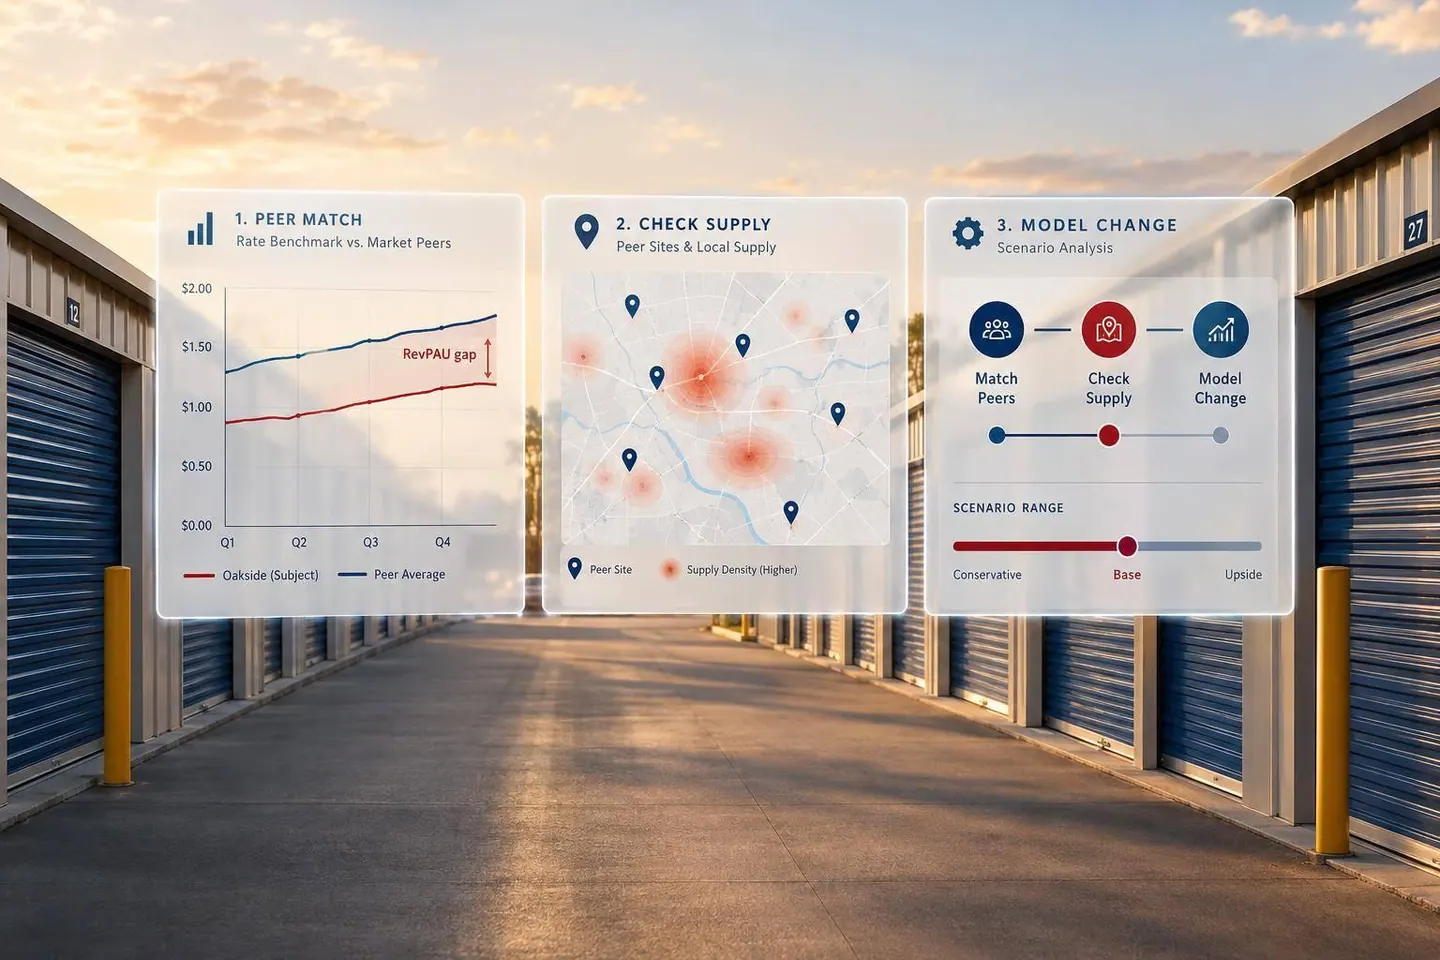

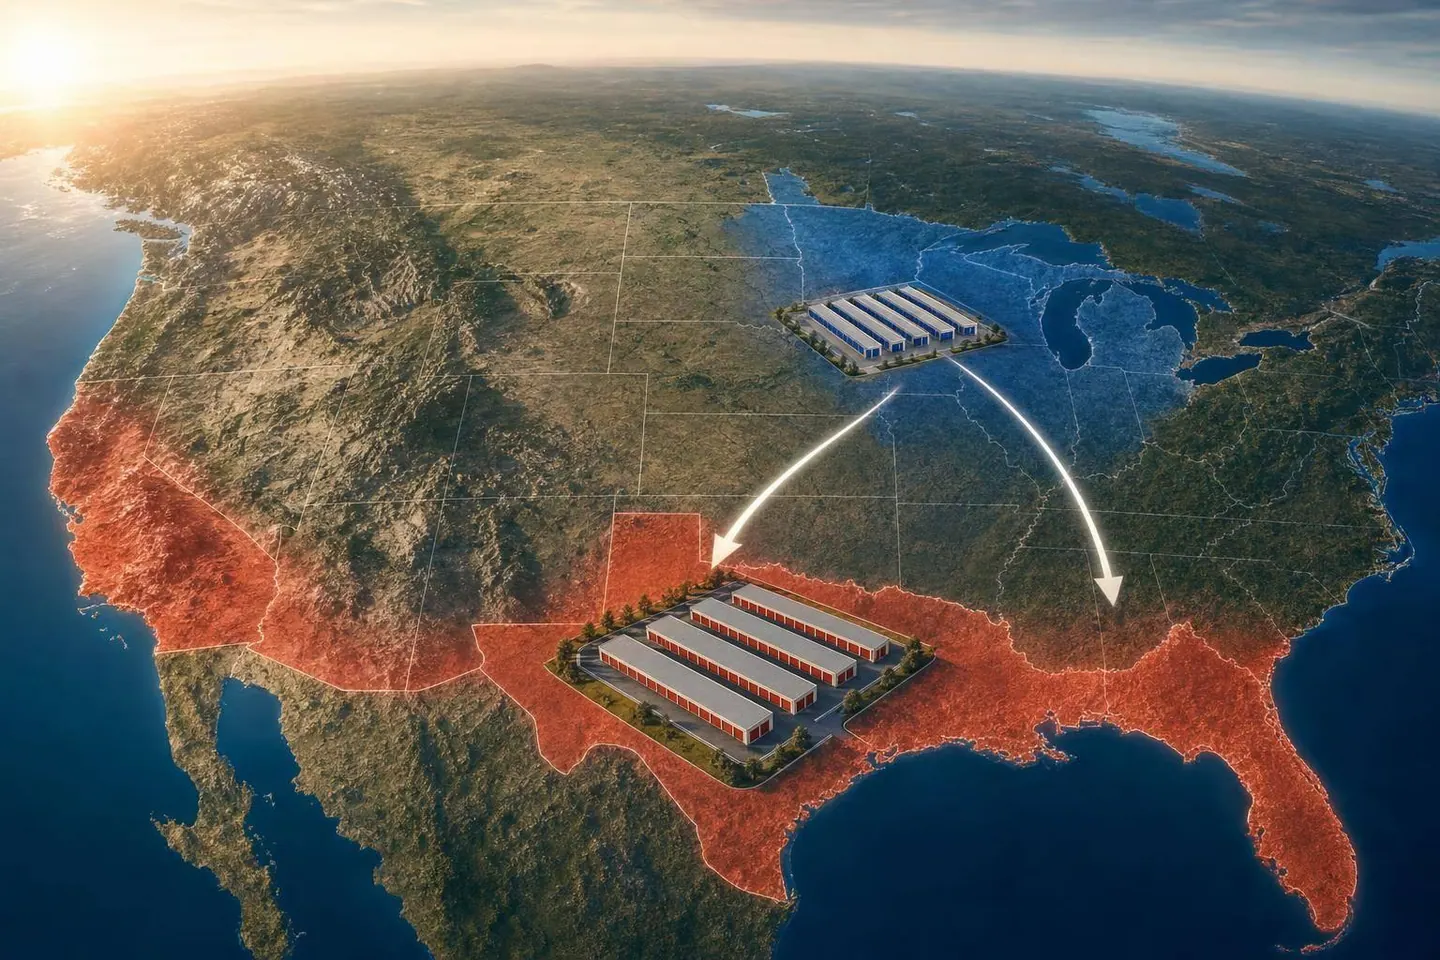
If I had to sum it up in one line: the better storage bet right now depends less on region and more on local supply, rent pressure, and your hold period.
Here’s the short version:
- Sun Belt markets still have long-term population growth, but many face near-term pressure from new supply, slower in-migration, and more concessions.
- Midwest markets often rely more on local demand than inbound migration, which can support steadier occupancy when supply stays tight.
- National street rates were $16.90 per square foot in June 2025, basically flat year over year at -0.1%, but up 0.7% month over month.
- In some Sun Belt markets, supply is the main issue right now. Phoenix had construction equal to about 6.2% of existing inventory, and Orlando was near 4.6%.
- In selected Midwest markets, rent trends were firmer. Aurora, IL posted 8.4% year-over-year rent growth in 2025, and a Q1 2026 update showed Midwest net rent per occupied square foot up 9.1% year over year.
So I wouldn’t treat “Sun Belt” as a buy signal or “Midwest” as a safe play by default. Over-reliance on regional labels can lead to overlooking risks like a potential market bubble.
I’d look at market trends and five specific factors first:
- Migration
- Demand staying power
- New supply
- Rent trend
- Buyer fit
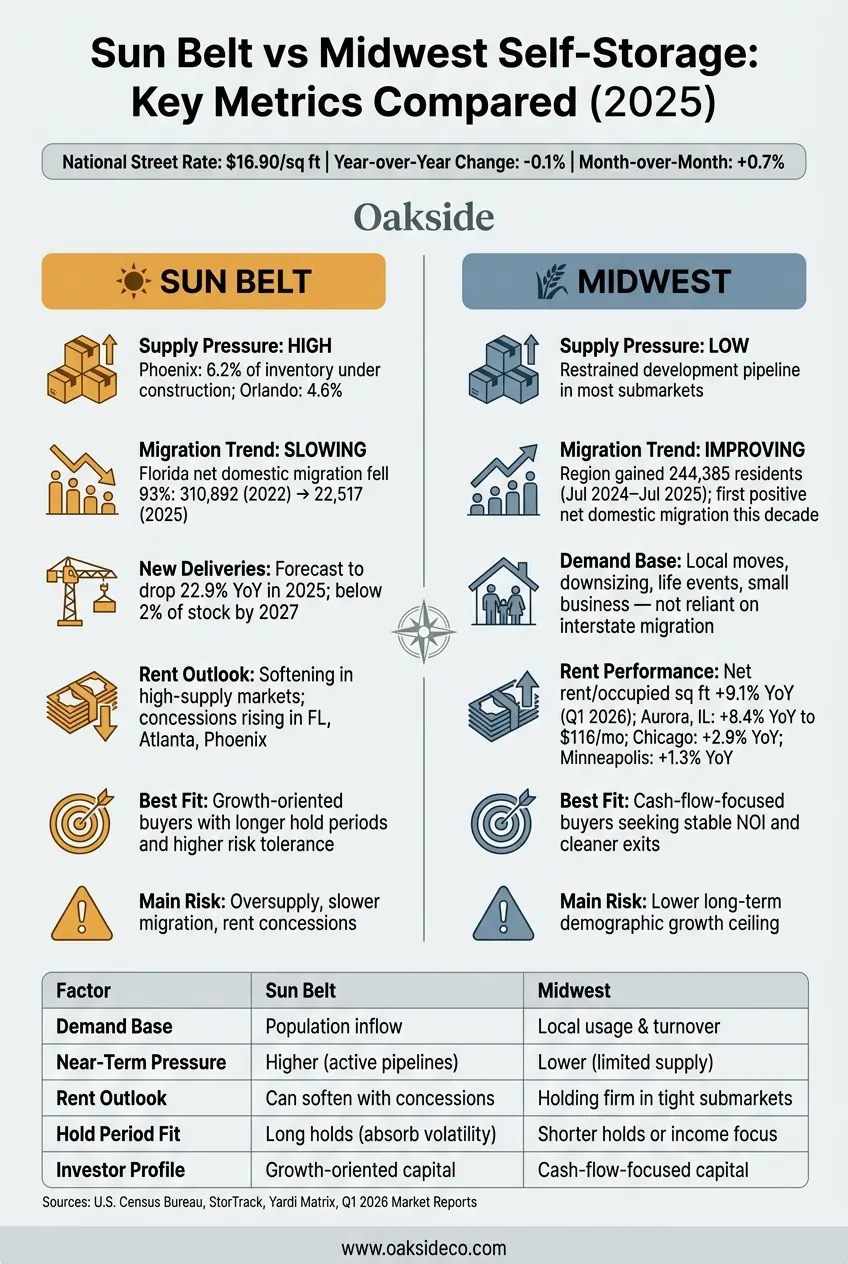
Sun Belt vs Midwest Self-Storage: Key Metrics Compared (2025)
| Factor | Sun Belt | Midwest |
|---|---|---|
| Demand base | More tied to population inflow | More tied to local moves and storage use |
| Near-term pressure | Often higher due to development pipelines | Often lower where supply is limited |
| Rent outlook | Can soften when concessions rise | Can hold better in tighter submarkets |
| Main risk | Too much new inventory at once | Lower long-run growth in some markets |
| Best fit | Buyers willing to wait through volatility | Buyers focused on steadier cash flow |
My takeaway: use the region as a starting filter, not the final answer. If you’re buying, selling, or holding, following a proven self-storage guide, the real work is in the submarket: nearby projects, achieved rents, occupancy, and exit planning and timing.
Migration drove a lot of Sun Belt storage demand from 2020 to 2022. That tailwind has faded. The Midwest, though, is showing a different setup: demand that leans less on people moving in from other states. The big question now is simple: can demand absorb all the new supply coming online?
Sun Belt demand after slower in-migration
Florida's net domestic migration dropped from 310,892 in 2022 to 183,646 in 2023, then to 22,517 in the year ending July 1, 2025. That's a fall of more than 90% from the peak. Arizona and Georgia moved in the same direction. Arizona fell from 68,315 to 31,107, while Georgia went from 79,102 to 27,333 over that same stretch. Texas still stood out as a major growth state, adding 391,243 residents between July 2024 and July 2025. Even so, slower migration changes the pace of household formation and lease-up.
The near-term problem is timing. New storage facilities are still being delivered, and they're competing for a smaller pool of relocating households. When supply outpaces tenant demand, lease-up can take longer, concessions can rise, and effective rents can slip. That can happen even in markets that are still adding people.
Tampa and Atlanta are good examples. Both are still dealing with a 2025 supply hangover after earlier migration and construction booms. That doesn't take them off the table for the long run. It does mean near-term underwriting can't just copy and paste 2021 move-in assumptions. For buyers, the key issue is whether today's demand can carry the asset through the planned hold period.
Midwest demand driven by local usage patterns
The Midwest doesn't rely as much on interstate migration to fill units. Demand there comes from repeat local usage. Think moves within the same submarket, older homeowners downsizing from larger family homes, life events like divorce or inheritance, college enrollment cycles, and small businesses using climate-controlled units for inventory or equipment.
That matters because it gives demand a different base. Instead of leaning hard on inbound migration, these markets often pull from day-to-day local needs.
The Midwest was the only U.S. region where every state gained population from July 2024 to July 2025. Regional growth reached 244,385, and the region posted positive net domestic migration for the first time this decade. A Q1 2026 market update found that Midwest net rent per occupied square foot climbed 9.1% year over year, the strongest regional figure listed in that report. Aurora, Illinois, posted an 8.4% year-over-year rent increase to $116 per month in 2025.
When local demand is strong and new supply stays limited, Midwest occupancy can hold up better. In those cases, asset performance depends more on local occupancy strength than on big migration headlines.
That split comes into sharper focus in the next section, where supply pipelines and rent trends separate short-term pressure from longer-term growth.
Supply is where the Sun Belt and Midwest stories split most clearly. Demographics point to where demand may head over time. Supply shows what that demand is up against right now.
Sun Belt: long-term growth story, near-term pipeline risk
Even with population growth, heavy construction is putting near-term rent growth under pressure. Nationally, about 2.2% of existing inventory is projected to be added in 2026, but several Sun Belt markets are well above that level.
Phoenix and Orlando stand out. Under-construction space in Phoenix equals about 6.2% of existing inventory, while Orlando is at roughly 4.6%. Tampa had nearly 1.6 million net rentable square feet under construction at the end of 2024.
When that much supply hits a market, new facilities tend to fight hard for tenants, often with steep concessions. Reports show that elevated supply in Florida, Atlanta, and Phoenix has led some operators to discount move-in rents to stabilize occupancy. That creates a tricky setup: occupancy can stay intact while concessions drag down effective rent. And that pressure tends to show up in both rent resets and buyer underwriting.
There is some relief on the way. Forecast 2025 deliveries were expected to fall 22.9% year over year, and deliveries are projected to drop below 2% of existing stock by 2027. Still, it makes sense not to assume stabilization too early. The better signal is whether competing facilities in the same trade area start showing occupancy gains without leaning harder on discounts.
The Midwest tells a different story because tighter supply has helped protect pricing in some markets.
Midwest: steadier rent performance in selected markets
The Midwest has benefited from a more restrained development pattern. While many Sun Belt metros pulled in heavy construction, a lot of Midwest submarkets did not attract the same level of developer attention. That restraint is showing up in operating results.
Midwest occupancy rose 86 basis points year over year in Q3 2025, and net rent per occupied square foot climbed 3.6% year over year during the same period. Chicago posted about 2.9% year-over-year advertised rent growth in 2025, while Minneapolis came in at around 1.3%. Both were ahead of the national figure of 0.6% year over year recorded in November 2025. Minneapolis also saw its three-year lease-up supply drop sharply, from 20.3% in 2022 to just 4.1% by June 2025, which cut forward competitive pressure in a meaningful way.
That said, the Midwest is not one single story. Chicago, Minneapolis, Indianapolis, Columbus, Kansas City, and smaller markets can each have very different demand and supply setups. A secondary Midwest market may have little new construction simply because rents and population growth do not support new development. Low supply sounds good on paper, but it only matters if demand is there too. Underwriting should test both.
Those operating gaps also shape buyer appetite, hold periods, and sale timing.
When supply and rent trends start moving in different directions, buyer demand tends to split based on hold period and risk tolerance. Day-to-day property performance shapes how buyers underwrite a region. But the main issue is simpler than that: what is the buyer trying to achieve, and how much execution risk can they live with?
When the Sun Belt fits a growth-oriented hold
Sun Belt assets tend to make the most sense when population and job growth are durable and the competitive supply picture is manageable. The long-term demographic story still matters. Dallas–Fort Worth, Houston, Atlanta, Phoenix, Orlando, Tampa, Austin, Charlotte, San Antonio, and Jacksonville remain among the nation's top household-growth metros. Over a full hold period, that kind of growth can support future storage demand.
But growth by itself isn't enough to justify paying up.
Buyers still need to pressure-test lease-up timing against nearby deliveries. The better setup usually looks more specific than a big metro headline. Think a high-barrier infill site, limited entitled competition, and a clear spread between in-place rents and market rents. That's where the case gets stronger.
So the Sun Belt isn't just for buyers chasing population growth. It's better suited to buyers who can handle timing risk and execute well.
When the Midwest fits a lower-risk hold or cleaner sale
The Midwest is almost the mirror image: less driven by growth, more driven by cash flow. These assets often appeal to buyers who want dependable current cash flow without heavy reliance on migration trends. Demand tends to come from local turnover and everyday use. If supply is also limited, that mix can lead to more predictable NOI than a Sun Belt asset still moving through lease-up.
For sellers, a Midwest asset can also make for a cleaner sale when past performance is stable and the comp set is easy for buyers to understand. The tradeoff is pretty clear: slower-growth markets may draw a smaller buyer pool, and the upside may be lower.
That means sellers should back up value with the basics:
- documented cash-flow durability
- verified rent comps
- a clear view of the nearby pipeline
Leaning on a broad regional story usually won't do the job.
Sun Belt assets fit buyers looking for upside and willing to take on more execution risk. Midwest assets fit buyers who want steadier cash flow and a cleaner exit.
How Oakside supports acquisition and disposition decisions
Choosing between a Sun Belt growth play and a Midwest income hold—or even comparing self-storage vs RV storage returns—isn't just a regional call. It's a property-level and submarket-level decision that depends on precise underwriting. Oakside Co works with self-storage and boat & RV owners on both sides of that call, offering institutional-grade analysis, transaction management, and access to a national investor network.
For a Sun Belt acquisition, Oakside Co can underwrite revenue-management upside. For a Midwest sale, it can position stable cash flow for disposition and line up the asset with the buyer pool that fits its risk profile.
Neither region wins across the board. The better choice comes down to your hold period, your financing assumptions, and how much short-term volatility you can handle.
Once you look past migration, supply, and rent trends, the main issue is simple: hold period.
| Factor | Sun Belt | Midwest submarkets |
|---|---|---|
| Hold-period fit | Long holds that absorb volatility | Shorter holds or income-focused strategies |
| Main upside | Long-term population and household growth | Stable demand, limited overbuilding |
| Main risk | New supply, slower migration, rent concessions | Slower long-term demographic growth and less higher upside |
| Sale strategy | Hold through lease-up | Exit when occupancy and rents are already stable |
| Investor profile | Growth-oriented capital | Cash-flow-focused capital |
That leads to one practical rule: start broad, then get specific.
State-to-state migration has slowed sharply from its pandemic peak, which makes current submarket data matter more than broad regional narratives.
So use the region as an early filter. Then underwrite the deal based on submarket supply, achieved rents, occupancy, and exit timing.
For owners weighing a hold or sale, Oakside Co can help underwrite submarket supply, test rent assumptions, and position the asset for the right exit.
How do I judge a submarket beyond the region?
Start by defining the facility’s true trade area. Use drive time, not just a circle on a map, and account for barriers like highways, rivers, and railroads that change how people move.
Then compare demand and supply at that level. As a rule of thumb, use 1–3 miles in urban areas and about 5 miles in suburban or rural areas.
Look at the local demographics, housing drivers, and the actual competitive set. From there, classify the market as undersupplied, balanced, or oversupplied based on occupancy and per-capita NRSF.
Also, stress-test the 24–36 month supply pipeline, not just the inventory that exists today. A market can look fine on paper and still get crowded fast if new space is about to hit.
What hold period fits Sun Belt storage today?
It depends on supply conditions in the market and whether the asset is stabilized.
In suburban Sun Belt markets with high supply risk and declining rents, investors often lean toward a value-add plan with a 3 to 5 year hold. That window can make sense when you're trying to improve the asset, ride out a rough patch, and sell once operations look better.
For stabilized assets in undersupplied metros with limited new construction, a longer hold may be a better fit. On the flip side, in oversupplied markets with falling rents, selling may be the smarter move.
When is the Midwest the better storage bet?
The Midwest tends to stand out when investors care more about stability and tight supply than the faster-growth, higher-supply swings you often see in Sun Belt suburbs.
That makes the region a strong fit for value-add deals in infill areas, where zoning rules or limited land make it hard for new projects to come online. As Nolen Masserman, Managing Director at Oakside, notes, investors expect those limits to support above-average rent growth over the next five to seven years.