7 Occupancy Metrics Self-Storage Owners Track
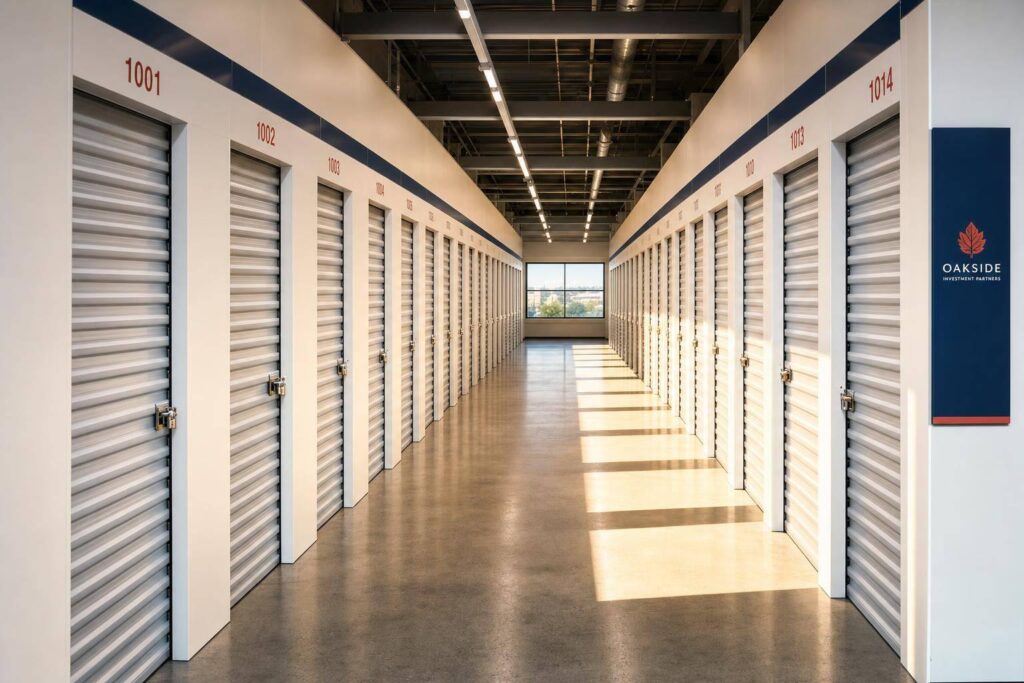
High physical occupancy can mask weak cash flow—track seven occupancy metrics to reveal true revenue quality and sale readiness.
Self-Storage Feasibility Study: Penetration Rates
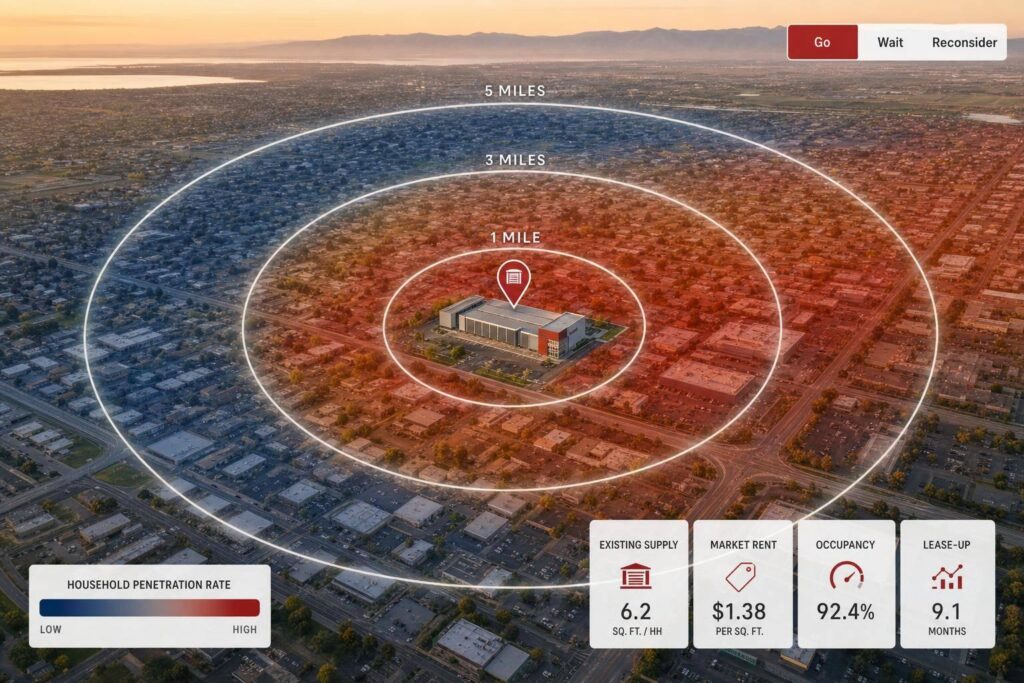
Use household penetration as a demand signal, then test supply, rents, occupancy and lease-up to decide go/wait/reconsider.
Household Formation Trends in Self-Storage Markets
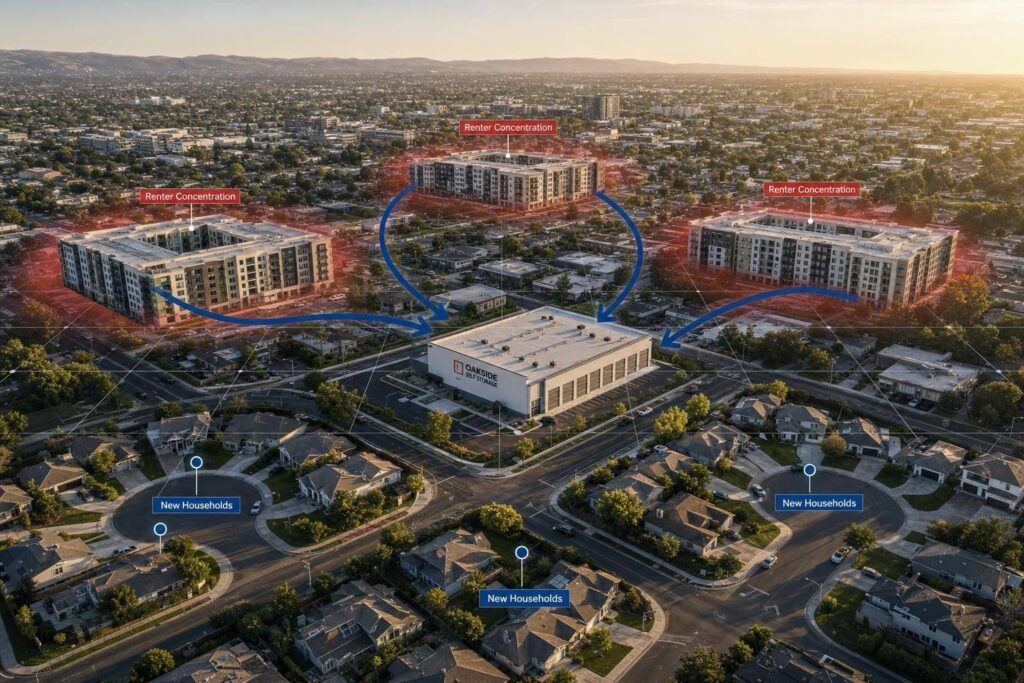
Self-storage demand follows household formation and movement more than population growth — prioritize renter mix, migration, age, and supply.
Boat RV Storage Zoning: Key Deal Risks
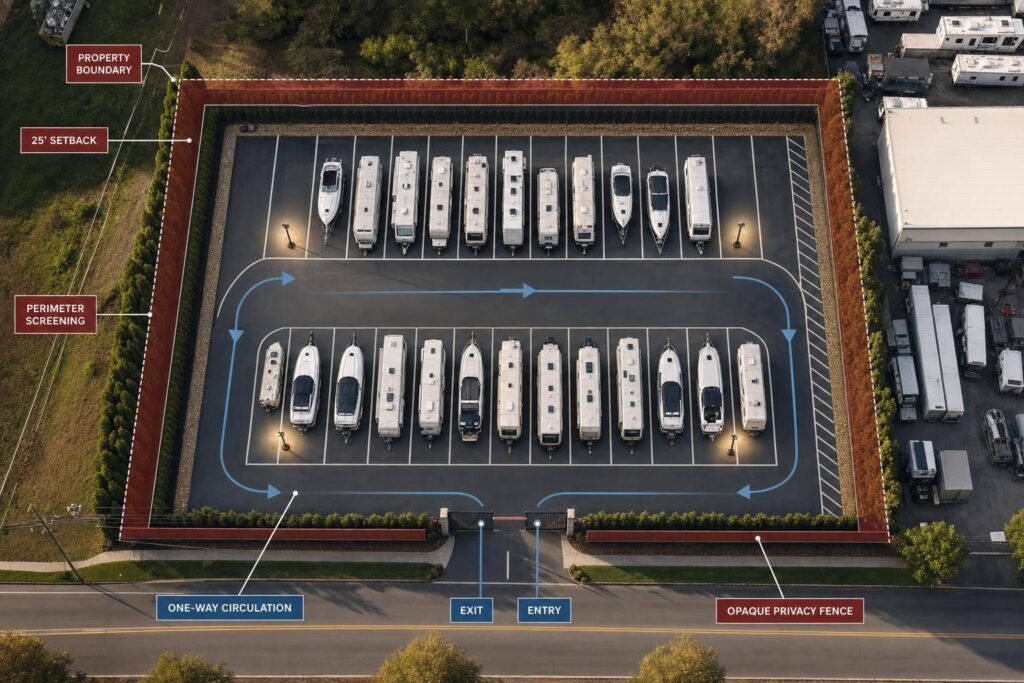
Boat and RV storage deals fail when zoning and site rules aren’t nailed—verify use, capacity, screening, lighting, circulation, and approvals first
Broker Value Opinion: Seller Questions
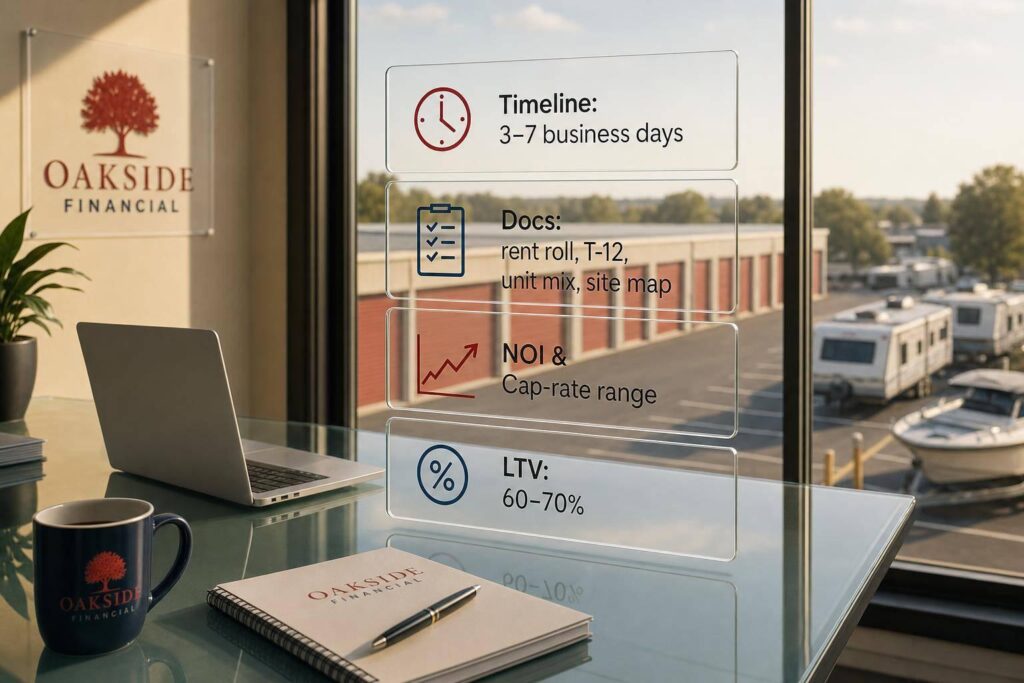
Timeline, docs, and pricing for BOVs on self-storage and boat/RV assets — 3–7 business days, key records, NOI/cap-rate ranges, and 60–70% LTV.
Forecasting Storage Cap Rates in New Markets
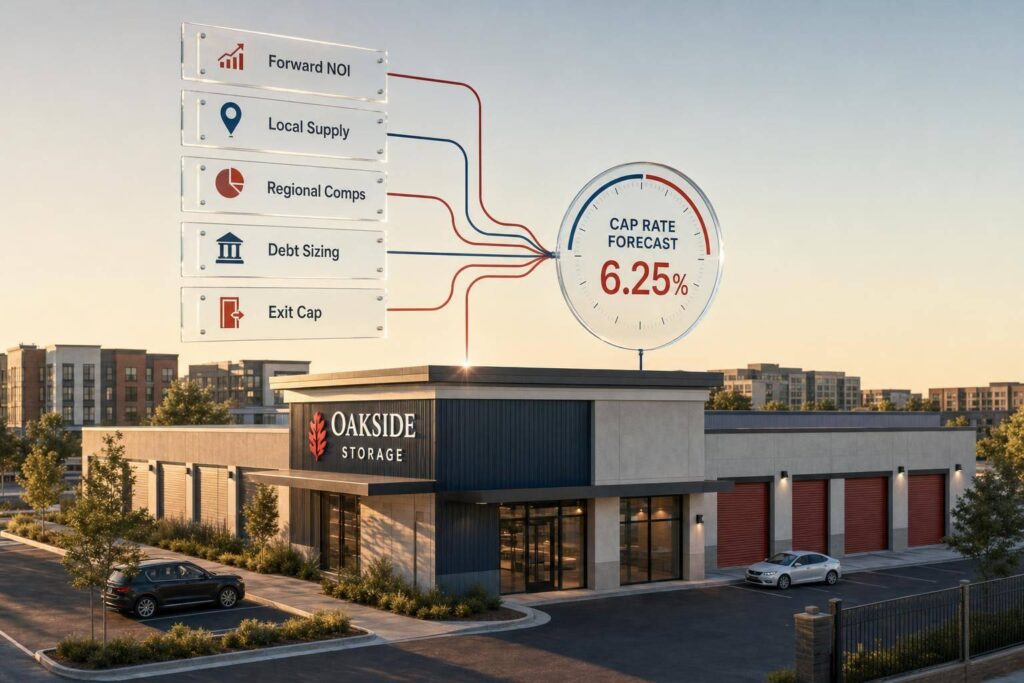
Anchor new-market storage valuations to forward NOI, local supply, regional comps, debt sizing, and conservative exit caps.
Move-In Rate Strategy for Self-Storage Owners
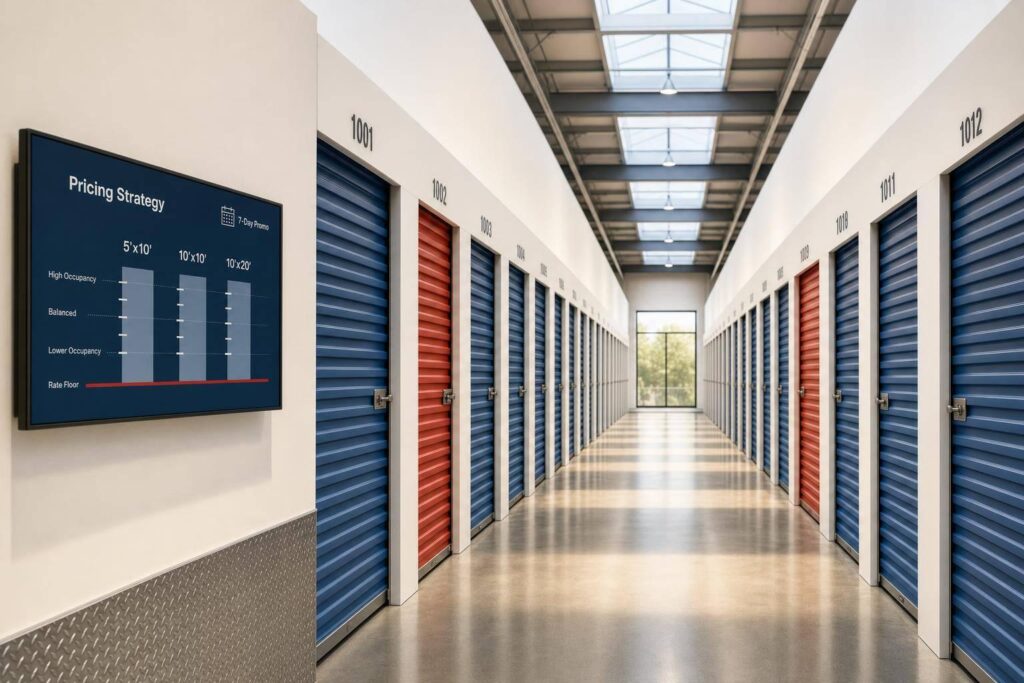
Set move-in rates by unit type, use occupancy triggers, short timed promos, and rate floors to protect NOI and asset value.
Opportunity Zone Exit Options for 2026

Mandatory OZ deferred-gain recognition hits Dec 31, 2026—compare sell, hold (10-year exclusion), or refinance to cover taxes.
Occupancy Risk in Self-Storage Acquisitions

High physical occupancy often masks weak cash flow; underwrite to collected rent, not the rent roll.
2026 Buyer Pricing Trends in Storage Deals

Buyers price storage on current NOI and tighter debt: Class A self-storage trades low-5%; secondary, value-add and boat/RV command wider yields.