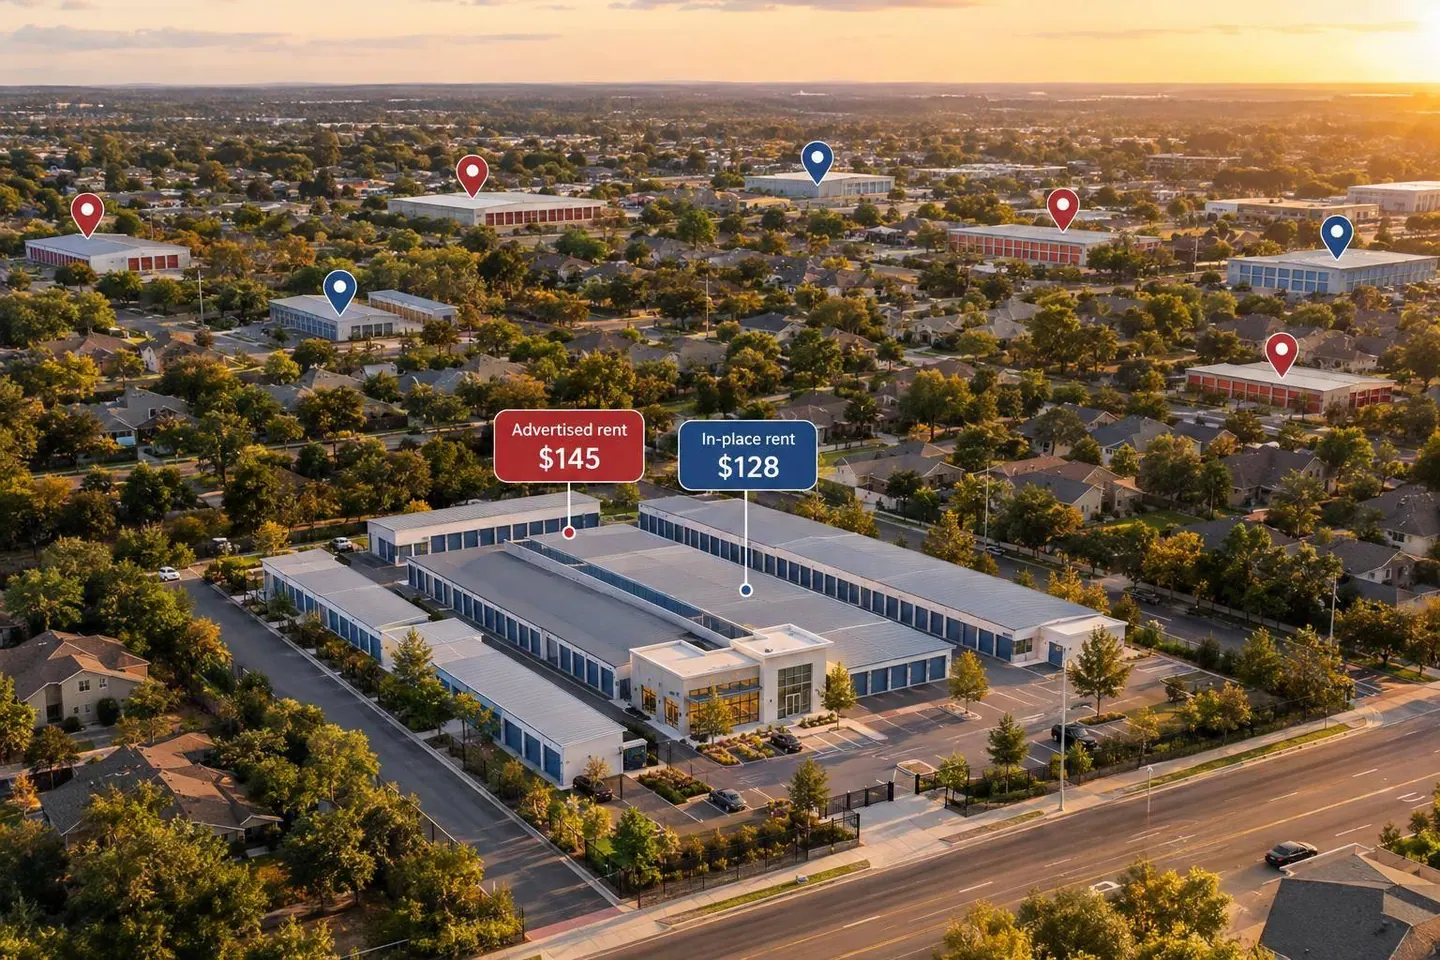

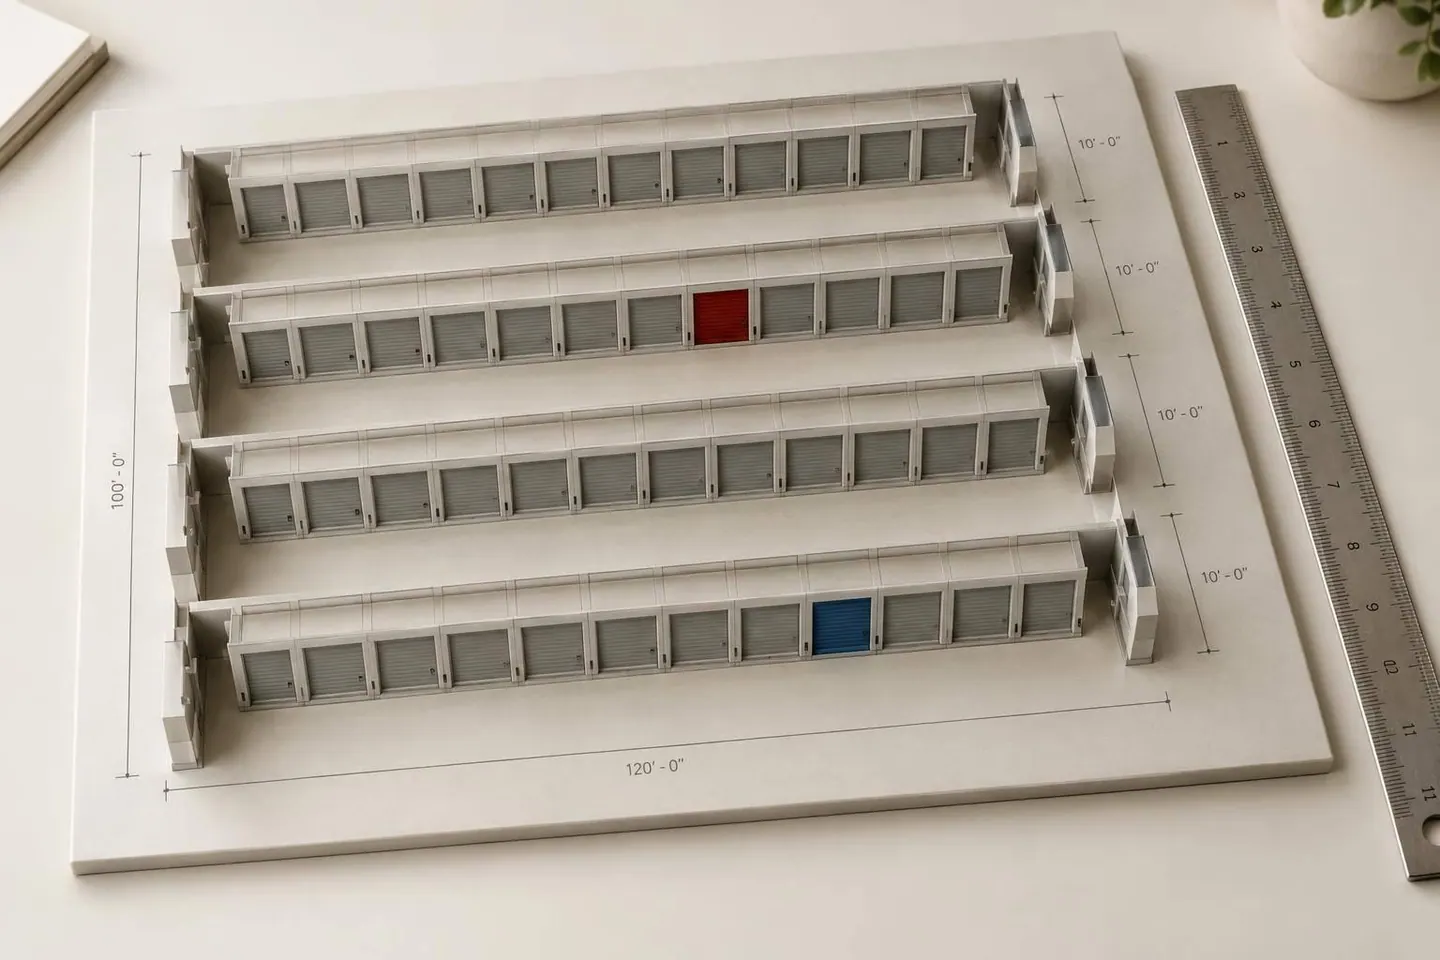
Storage revenue per NRSF measures rent earned across all rentable space - not just occupied units. Calculate it as storage rent ÷ total net rentable square feet, using the same reporting period. Public-company revenue growth ranged from 0.1% for Public Storage in the first nine months of 2025 to 2.0% for SmartStop in Q3 2026, but these results do not establish a national revenue-per-NRSF benchmark.
The key checks for owners and buyers:
- Separate rent from other income. Asking rates, achieved rent, and total revenue measure different things.
- Compare like properties. Region, supply, unit size, property condition, and self-storage versus boat/RV use can change the results.
- Find what drove growth. Review pricing, occupancy, concessions, collections, and unit mix together.
- Verify before valuing. Reconcile rent rolls, ledgers, and rentable area, then test rents 5%–10% below the base case alongside expenses and capital needs.
Higher revenue per NRSF alone does not prove stronger demand or a higher property value.
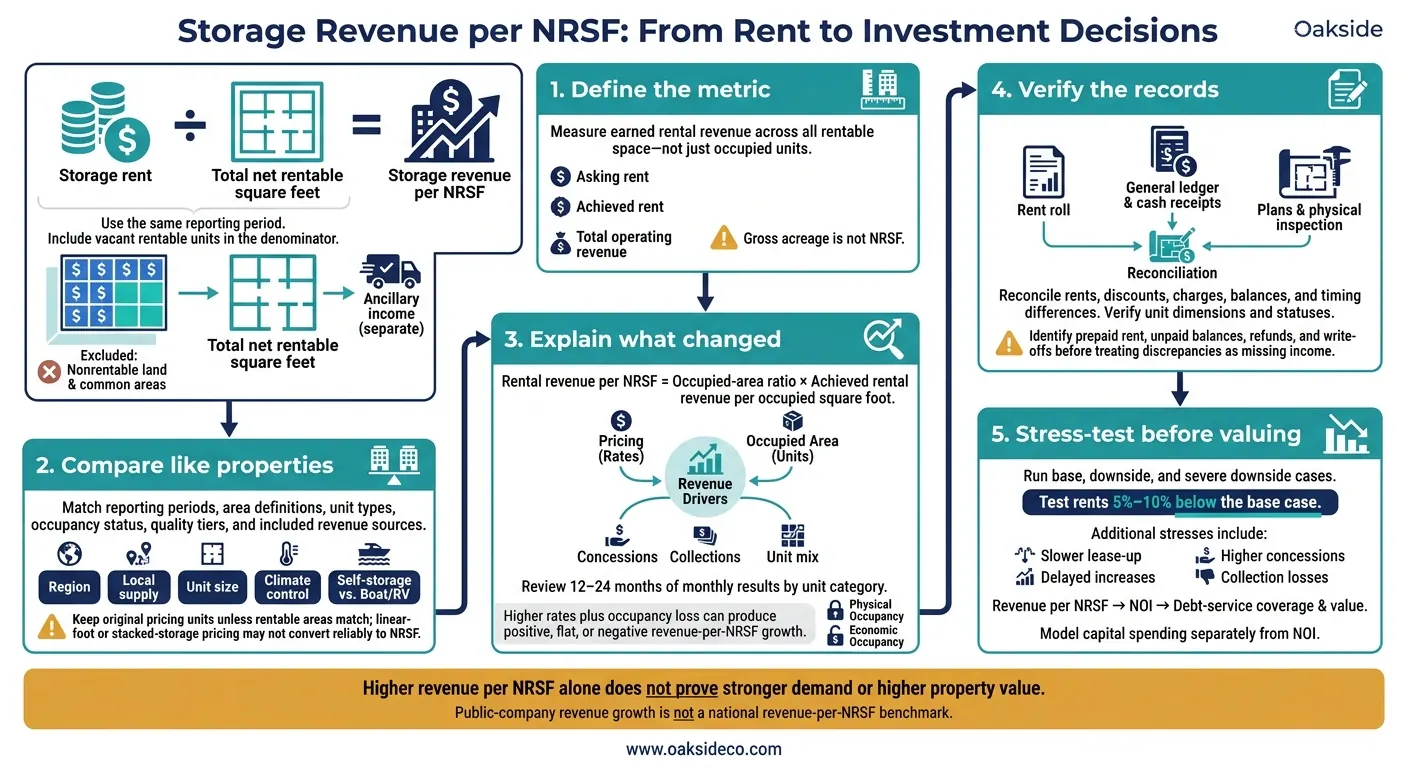
Storage Revenue per NRSF: From Rent to Investment Decisions
Public-company results show flat to low-single-digit revenue growth, but they do not establish a national revenue-per-NRSF benchmark. These portfolios offer a sense of direction - not a nationwide benchmark for self-storage or boat/RV assets. Public reporting is strongest for self-storage. Boat/RV data remains too limited to support a national revenue-per-NRSF benchmark.
The table separates company-level results from the national benchmark, which remains unproven.
Revenue, Asking Rents, Occupancy, and Concessions
| Metric | Reporting period | Direction | Verified magnitude | Source | Evidence limits |
|---|---|---|---|---|---|
| Same-store revenue | First nine months of 2025 | Nearly flat | +0.1% | Public Storage | Portfolio revenue, not a revenue-per-NRSF measure |
| Square-foot occupancy | First nine months of 2025 | Down | 91.4% to 90.7%; −0.7 percentage points | Public Storage | Physical occupancy, not economic occupancy |
| Annual contract rent per occupied square foot | First nine months of 2025 | Nearly flat | $22.86 to $22.88; +0.1% | Public Storage | Contract pricing on occupied space, not recognized rent across all NRSF |
| Same-store revenue | Q3 2026 | Up | +2.0% year over year | SmartStop earnings-call transcript | Not a revenue-per-NRSF measure |
| Advertised web rates | Q3 2026 | Down | −3.5% | SmartStop earnings-call transcript | Advertised pricing, not achieved rent |
| Concessions | Q3 2026 | Down | Approximately 25%–30% year over year | SmartStop earnings-call transcript | Does not isolate the revenue effect |
Same-store revenue growth is not the same as revenue-per-NRSF growth. The two align only when rentable area and revenue definitions stay unchanged. To assess national rate stability, compare monthly data by unit size and climate-control type over month-over-month, quarter-over-quarter, and year-over-year periods.
Concessions can make headline pricing misleading. Track advertised rent alongside net move-in rent, promotion length, renewal pricing, and bad debt.
How Rates, Occupancy, and Unit Mix Affect Growth
To boost rental revenue, the operating relationship is occupied-area ratio × achieved rental revenue per occupied square foot. Add ancillary revenue per NRSF only when analyzing total operating revenue.
Keep new-tenant pricing separate from existing-tenant increases, and physical occupancy separate from economic occupancy. Otherwise, discounts, unpaid rent, or shifts in the occupied unit mix can look like pricing gains.
| Scenario | Conditional revenue-per-NRSF effect | Principal driver | Durability | Review risk |
|---|---|---|---|---|
| Rising rates, stable occupancy | Usually positive | Higher achieved rent | Stronger if renewals and collections hold | Increases may mask rising bad debt or later move-outs |
| Rising rates, occupancy loss | Positive, flat, or negative | Price gains versus lost occupied area | Depends on retention and replacement demand | Rate gains may not offset lost rent |
| Flat rates, occupancy recovery | Usually positive | More occupied square feet | Depends on retaining new tenants | Discounted lease-up may lift physical occupancy more than revenue |
| Falling asking rates, reduced concessions | Can be positive or neutral | Better net effective pricing | Depends on promotion costs and retention | Lower concessions may not fully offset lower rates |
| Mix-led growth | Can lift blended revenue | More occupied higher-rent space | Depends on sustained demand for that mix | Premium-unit gains can hide weakness elsewhere |
Review 12–24 months of monthly results by unit category before attributing growth to pricing or mix.
These drivers vary by region, asset type, and quality tier - the focus of the next section.
Regional results differ most where supply, unit mix, and asset type vary.
Regional Supply and Rent Trends
This review uses six editorial regions, rather than standard regional groupings:
- Northeast: CT, ME, MA, NH, NJ, NY, PA, RI, VT
- Midwest: IL, IN, IA, KS, MI, MN, MO, NE, ND, OH, SD, WI
- Southeast: AL, AR, DE, DC, FL, GA, KY, LA, MD, MS, NC, SC, TN, VA, WV
- Southwest: AZ, NM, OK, TX
- Mountain West: CO, ID, MT, NV, UT, WY
- Pacific: AK, CA, HI, OR, WA
Use the same period and denominator across regions. The September 2025 figures below show metro-level asking rates - not achieved revenue per NRSF. Confidence in these advertised-rate observations is moderate.
| Geography / state group | Asset type | Reporting period | Pricing basis | Occupancy context | Rate trend YoY | Supply pressure | Source / confidence |
|---|---|---|---|---|---|---|---|
| New York–Connecticut / Northeast | Combined boat/RV | September 2025 | Advertised annualized parking rent per SF | Unavailable | +11.4% | Unavailable | Yardi Matrix / Moderate |
| Chicago / Midwest | Combined boat/RV | September 2025 | Advertised annualized parking rent per SF | Unavailable | +7.7% | Unavailable | Yardi Matrix / Moderate |
| Los Angeles / Pacific | Combined boat/RV | September 2025 | Advertised annualized parking rent per SF | Unavailable | +12.8% | Unavailable | Yardi Matrix / Moderate |
No September 2025 metro-rate observation is reported for the Southeast, Southwest, or Mountain West.
Dense metros such as Los Angeles, New York–Connecticut, and Chicago posted stronger boat/RV asking-rate growth. Broader reporting also pointed to tighter supply in Boston, Chicago, and Minneapolis, alongside greater pricing and occupancy pressure in Sun Belt markets with heavy deliveries, including Florida, Phoenix, Las Vegas, and parts of Texas.
Supply pressure and unit mix shape achievable revenue per NRSF. Before applying a regional assumption, compare submarket deliveries over 12, 36, and 60 months as a share of existing inventory.
Comparing Self-Storage, Boat, and RV Revenue
Keep the original pricing unit unless rentable areas match. Smaller parking spaces helped drive 2025 boat/RV asking-rate growth, making per-square-foot figures sensitive to space mix.
Separate base rental revenue from power charges, washing, winterization, detailing, and other services. Gross acreage is not NRSF because it includes nonrentable land.
Boat/RV properties also price spaces in different units. That means raw rate changes cannot be compared directly with self-storage revenue per NRSF.
| Asset type | Pricing basis | Area definition | Normalization needs | Comparison limits |
|---|---|---|---|---|
| Self-storage | Monthly rent per unit | Enclosed rentable unit area | Match size, climate control, access, concessions, and revenue period | Hallways and common areas are not rentable units |
| Boat storage | Per vessel, space, or linear foot | Verified stall or enclosed-unit area, where applicable | Match vessel dimensions, indoor/outdoor configuration, stacking, seasonality, security, and services | Linear-foot or stacked-storage pricing may not convert reliably to NRSF |
| RV storage | Per space or vehicle | Verified stall or enclosed-unit area | Match length, width, height clearance, coverage, power, security, wash/dump access, and turning space | Covered and uncovered spaces have different costs and utility |
| Combined boat/RV | Mixed space, vehicle, and linear-foot pricing | Separate area schedules by product | Split boat/RV uses and open, covered, and enclosed inventory | Blended figures can hide mix changes; limited samples are not national benchmarks |
Property Quality and Achieved Revenue
Treat quality as a performance variable, not a label. Use locally defined tiers rather than assumed Class A/B premiums. The supplied evidence does not establish numerical revenue premiums by tier.
Higher advertised rents can be offset by vacancy, concessions, or inventory that does not match demand. Premium features also add operating and capital costs. Test what they contribute using achieved rent, occupancy, expenses, and a property-specific capital plan.
Assess quality’s effect on revenue by looking at pricing, occupancy, and retention together.
| Working tier | Location, access, security, and systems | Condition, inventory, and services | Achieved revenue and occupancy | Capital needs |
|---|---|---|---|---|
| Institutional-quality | Strong location and access; strong security; digital leasing, payments, and records | Well-maintained improvements; climate control, coverage, unit mix, and services matched to demand | Can support rates and retention; no verified premium or occupancy threshold | Fund technology, systems, and amenity replacement |
| Stabilized middle-market | Functional access and security; fewer digital features | Older but serviceable improvements; potentially less efficient mix or fewer services | Reliable occupancy and cash flow may offset lower rents; numerical comparison unavailable | Maintenance and selective upgrades |
| Challenged or redevelopment-oriented | Weak access, security gaps, or inconsistent operating records | Deferred maintenance, obsolete layouts, or poorly matched inventory | Revenue and occupancy may be constrained; recovery depends on the property | Potentially extensive repairs, reconfiguration, and lease-up spending |
Market trends matter only when property records back them up.
Tracking Rent and Occupancy
Compare monthly and trailing-12-month rental revenue per verified NRSF with budget and prior-year results. Explain changes through pricing, occupancy, unit mix, and collections. Track achieved rent, move-in and renewal rates, concessions, delinquency, bad debt, churn, and ancillary income by unit type. Report physical occupancy by both unit count and rentable area. Define economic occupancy separately, and don't count reservations as collected revenue.
Make sure revenue per NRSF uses all rentable NRSF. Check whether move-outs offset renewal increases or short-term discounts support higher move-in rates. Separate lasting gains from expiring promotions and seasonal shifts in boat/RV occupancy. Review results alongside NOI margin, expense growth, market rents, and capital needs - not as a standalone valuation measure.
If the numbers don't reconcile, go straight to the rent roll and cash ledger.
Reconciling Rent Rolls, Revenue, and NRSF
Match unit-level rents, discounts, charges, and balances to the general ledger and cash receipts. Account for prepaid rent, unpaid balances, refunds, write-offs, and month-end timing differences before labeling discrepancies as missing income. Verify unit numbers, dimensions, and statuses against plans and a physical inspection.
Keep rental-only revenue separate from total operating revenue. Identify tenant protection income, late fees, merchandise, truck rental, and administrative fees rather than treating them as rent. Keep vacant rentable units in the denominator. Identify complimentary, management-use, and other nonrevenue space separately, and disclose any changes in how they're treated.
Once the records tie out, stress-test the assumptions before pricing the deal.
Buyer Underwriting and Valuation Checks
Use the checks below to connect operating results to price. Run base, downside, and severe downside cases. Test 5.0% to 10.0% lower rents, slower lease-up, delayed increases, higher concessions, and collection losses. Measure the effects on revenue per NRSF, NOI, debt-service coverage, and value. Model capital spending separately from NOI.
| Item reviewed | Analytical test | Warning signal | Potential valuation effect |
|---|---|---|---|
| Historical revenue | Normalize monthly and trailing-12-month revenue | Nonrecurring income drives growth | Lower normalized revenue and NOI |
| Rent-roll accuracy | Verify tenant accounts against leases and collections | Unverified account balances | Adjust income |
| Physical NRSF | Verify rentable area against plans and field measurements | Overstated area | Recalculate revenue per NRSF and value |
| Economic occupancy | State the gross potential rent formula and how concessions, delinquency, and bad debt are treated | High physical occupancy but weak collections | Lower effective revenue and stabilized NOI |
| Lease-up assumptions | Test absorption by unit type, season, and historical leasing pace | Fast stabilization without supporting demand | Delay cash flow and reduce present value |
| Post-acquisition rate potential | Compare in-place rents with recent signed leases and adjusted market asking rents | Upside depends only on advertised rates | Reduce rent-growth and exit assumptions |
| Competing supply additions | Review planned projects, projects under construction, and delivery dates | New inventory competes for the same demand | Increase vacancy and concession allowances |
| Insurance and property taxes | Obtain renewal quotes, assessments, and reassessment rules | Forecast keeps costs unlikely to survive a sale | Lower NOI and financing capacity |
| Required capital spending | Inspect roofs, paving, drainage, gates, security, and HVAC | Unfunded repairs or near-term replacements | Increase reserves or reduce the offer price |
Higher revenue per NRSF doesn’t always mean stronger demand or higher value. It may reflect higher pricing, an occupancy recovery, or a larger share of smaller units. Local supply, property quality, and customer mix affect whether those gains will last - but first, the properties being compared must be on the same footing.
Limits of Comparisons and Forecasts
Before forecasting, make sure NRSF definitions, unit types, quality tiers, occupancy status, reporting periods, and included revenue sources match across properties.
Use achieved revenue, not asking rent. Missing ancillary-income data, boat/RV seasonality, reporting lags, and survivorship bias can all weaken a property-level forecast or valuation judgment. This is why sophisticated investors perform sensitivity analysis to stress-test assumptions.
Applying Findings to Operations, Financing, and Sales
The test isn’t just whether revenue changed. It’s whether that change will last. Identify what drove it, test its staying power, and then decide how to act.
Separate gains that property operations can deliver from market-driven appreciation. Use lasting cash flow to guide refinancing, capital planning, and sale preparation. Revenue per NRSF should inform those decisions - not serve as a standalone valuation metric.
Oakside Co supports self-storage and boat/RV owners with data-driven underwriting, transaction planning, and disposition support.
How can I benchmark my property without national NRSF data?
Build a local, like-for-like benchmark using your property and comparable properties. To track revenue per available unit (RevPAU), divide collected rent - not advertised rates - by the average number of rentable units.
Track achieved rate growth, in-place rent growth, new move-in rate growth, asking-rate changes, and discount-adjusted growth.
Compare economic occupancy with physical occupancy. A gap above 10% can point to concessions or a drag from collections. Keep unit mixes, climate-controlled units, and boat/RV assets separate, and update the benchmark at least quarterly.
When should I prioritize occupancy over rent increases?
Prioritize occupancy when the gap between physical and economic occupancy exceeds 10%. That gap signals that excessive concessions, delinquency, or management issues are cutting into net operating income. Economic occupancy is the most reliable measure of actual cash flow.
If rent increases push tenants to leave and widen the gap, focus on steady collections to maintain economic occupancy - not higher advertised rents that can lead to costly vacancies.
How can I tell if premium amenities justify their costs?
Check whether rent premiums cover added operating costs and capital investment after accounting for concessions, collection losses, and vacancy risk. If enclosed units are a baseline requirement, confirm that rents cover higher insurance, taxes, and maintenance costs.
Use verified property data, not broad market assumptions. Stress-test flat or declining rents to check whether the premium still supports your debt service coverage ratio and investment goals.