
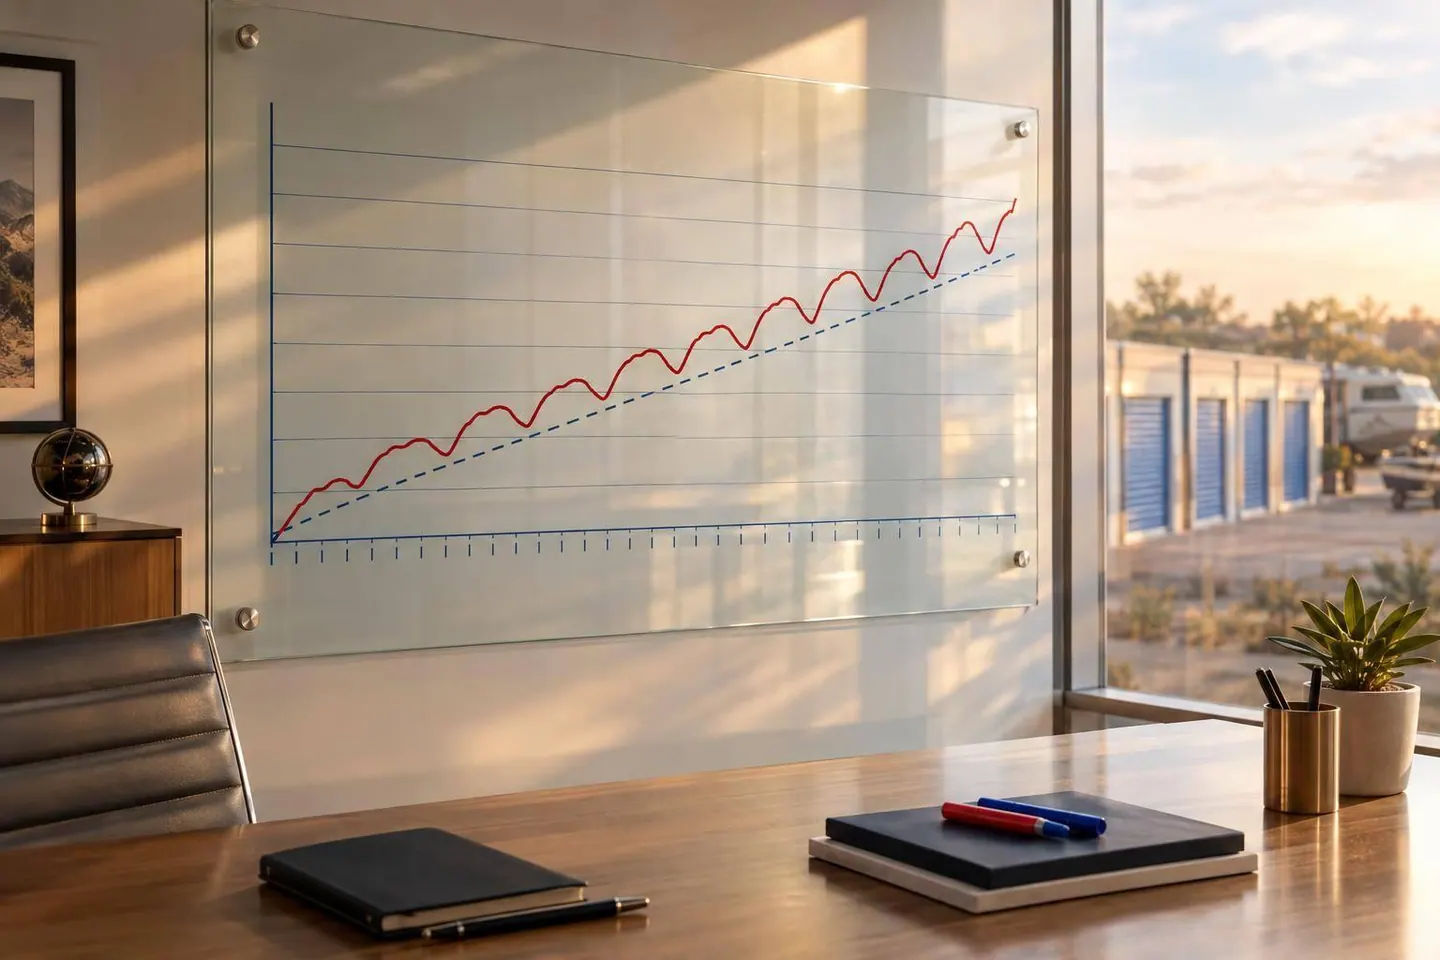
I base storage value on collected income through a full seasonal cycle - not peak occupancy. Before setting rent forecasts, I review 24–36 months of monthly results and model revenue, expenses, and cash needs from the purchase or opening date.
Here’s what I check:
- Self-storage: Local moving patterns, winter slowdowns, unit sizes, rents, and concessions.
- Boat/RV storage: Recreation seasons, regional weather, space sizes, and seasonal renewals.
- Lease-up timing: Net move-ins after departures, nearby new supply, and opening delays of 3, 6, and 12 months.
- NOI and value: Collected rent, seasonal costs, cash reserves, and income that holds through peak and slow months.
My rule: <u>occupied space isn’t the same as earned income</u>. I test slower leasing and weaker off-season demand before setting value or sizing debt.
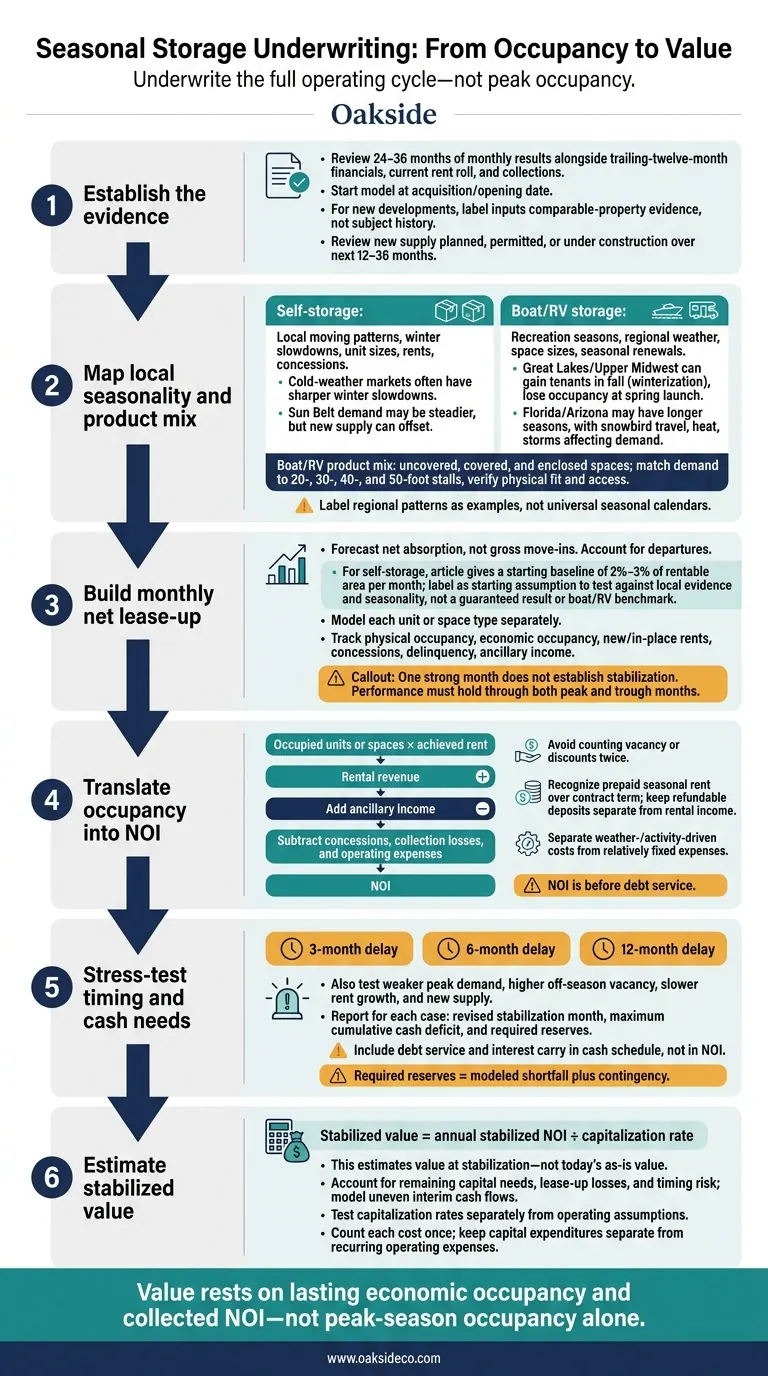
Seasonal Storage Underwriting: From Occupancy to Value
Seasonal Demand and Regional Differences
Household moves, home sales, renovations, student turnover, and military transfers drive self-storage demand. Build monthly revenue forecasts around local calendars and activity, not just the season.
Cold-weather markets often see sharper winter slowdowns. Sun Belt markets may hold steadier, though new supply can offset demand from people moving into the area. Model coastal storm-related demand separately from recurring seasonal demand, and translate each pattern into monthly absorption.
Leasing Windows and Lease-Up Pace
Forecast net absorption, not gross move-ins. Move-outs can start before occupancy stabilizes and wipe out leasing gains.
Start with a baseline monthly absorption rate of 2%–3% of rentable area, then test it against local demand and seasonality.
Break the forecast down by unit type to reflect differences in demand and leasing speed. Small units may draw short-term student renters, while larger units rely more on household moves and renovations. Month-to-month leases let you adjust rents faster, but they also increase turnover after peak season.
Effects on NOI and Value
The underwriting test is straightforward: do seasonal occupancy gains turn into collected revenue? Concessions, shorter stays, marketing costs, and seasonal utility bills can reduce NOI. Before sizing debt service and reserves, test a one- to three-month lease-up delay and weaker winter occupancy. Property value should reflect both stabilized NOI and the time needed to reach it.
Boat/RV storage follows the same underwriting rules, but its seasonal shifts depend more on recreation cycles and storage constraints.
Seasonal Demand and Regional Differences
Boat/RV storage demand varies by region and recreation cycle.
Great Lakes and Upper Midwest facilities can gain tenants during fall winterization and then lose occupancy at spring launch. Florida and Arizona may support longer usage seasons, but snowbird travel, heat, and storms still affect demand. Waterfront and destination properties often track boating, camping, and tourism calendars; inland sites rely more on local ownership, HOA parking restrictions, and convenient access.
These regional patterns shape which space types lease first and how soon occupancy stabilizes.
Leasing Windows and Lease-Up Pace
Underwrite uncovered, covered, and enclosed spaces separately. Match demand to 20-, 30-, 40-, and 50-foot stalls, then check aisle widths, turning room, and gate clearance. Verify power availability and access hours, too. Even high local ownership counts won't fill spaces that can't fit the equipment. Covered and enclosed spaces also attract customers who want protection from sun, snow, and storms - not just a place to park.
Use local monthly leasing records to find booking and renewal windows for each space type. Seasonal contracts cluster renewals around fall winterization and spring launch. Track inquiries and cancellations by space type so interest in uncovered parking doesn't get mistaken for demand for premium enclosed units.
Effects on NOI and Value
Once you've established the space mix and seasonal leasing patterns, use them to forecast collected revenue and stabilized NOI.
Separate base rent from power, winterization, haul-out, and other onsite service income. Handle seasonal prepayments carefully: cash received upfront isn't automatically revenue earned that month. Budget for snow removal and freeze protection in northern markets, along with storm preparation, insurance, and cleanup in coastal markets.
Model recurring income by space type, not peak-season occupancy. Test weak fall bookings, spring departures, and slower leasing of premium spaces separately. High physical occupancy can hide discounted seasonal contracts or empty higher-rent spaces. Model revenue for each space type before stabilization, and align the forecast with the acquisition or opening date.
After mapping seasonality, use the closing date and opening window to estimate how soon revenue can stabilize.
Acquisition Dates and Opening Windows
Compare 24–36 months of monthly history with trailing-twelve-month financials, the current rent roll, and collections. Closing during peak season can mask the next downturn. Buying in the off-season requires enough cash to reach the next leasing window.
For new developments, label assumptions as comparable-property evidence, not actual subject history. Adjust for product mix, access, pricing, and concessions. Review recent deliveries and supply planned, permitted, or under construction over the next 12–36 months.
| Opening window | Peak/trough behavior | Monthly absorption basis | Stabilization evidence | Downside case |
|---|---|---|---|---|
| Before demand builds | Self-storage may attract early spring moves; boat/RV timing depends on regional recreation and weather patterns. | Comparable net absorption by product type | Performance holds through the following trough | Late demand extends carrying costs |
| During peak demand | Strong initial leasing may mask seasonal departures | Peak-month evidence, tapering to shoulder and trough rates | Results hold after peak demand fades | Weaker peak leasing or higher move-outs |
| After peak demand | Vacant inventory may carry into the next leasing window | Observed off-season net absorption | A complete peak-to-trough cycle supports the forecast | New supply arrives before demand recovers |
| Delayed or phased opening | Construction shifts available inventory into another leasing season | Separate schedules for each delivered phase | Sustained performance without temporary concessions | Missed bookings increase deficits and reserve needs |
Use the monthly schedule to check whether the opening pace holds through the trough.
Monthly Absorption and Stabilization
Build monthly schedules by unit or space type. Track physical occupancy, economic occupancy, new and in-place rents, concessions, delinquency, and ancillary income.
Define stabilization for each property using sustained occupancy, achieved rents, normal concessions, collections, and recurring expenses across both peak and trough months. For boat/RV assets, account for seasonal renewals and retrieval-related departures. One strong month does not establish stabilization.
Then use these schedules to test how delays affect cash needs.
Lease-Up Delays and Downside Scenarios
Test opening delays of 3, 6, and 12 months, along with weaker peak demand, higher off-season vacancy, slower rent growth, and new supply. Use local moving patterns for self-storage and regional recreation timing and weather patterns for boat/RV storage.
For each case, report the revised stabilization month, maximum cumulative cash deficit, and required reserves. Calculate NOI before debt service, then include debt service and interest carry in the cash schedule. Size reserves to cover the modeled shortfall plus contingency, not just the added construction months.
Monthly Revenue and Expenses
Use the monthly lease-up schedule to turn seasonal occupancy into NOI. When vacancies occur matters as much as average occupancy. Both asset types follow the same underwriting logic, but seasonal demand and expense spikes vary by product and region.
Two properties with the same annual average occupancy can generate different NOI if one loses customers during premium-rate months. Calculate monthly rental revenue as occupied units or spaces × achieved rent. Add ancillary income, then subtract concessions, collection losses, and operating expenses to reach NOI. Check the result against gross potential rent, without counting vacancy or discounts twice.
| Asset type | Seasonal revenue drivers | Seasonal risks | Expense patterns | Valuation sensitivities |
|---|---|---|---|---|
| Self-storage | Unit-size and climate-control premiums; rent adjustments; ancillary fees | Cold- or wet-season leasing slowdowns; promotional discounts | Utilities, marketing, and repairs | Stabilized occupancy, achieved rents, concessions, collection loss, and tax reassessment after sale |
| Uncovered boat/RV storage | Seasonal contracts; access and security features | Weather-driven departures; travel and recreation cycles | Grounds work, surface repairs, drainage, and snow removal | Seasonal renewals, achieved rates, and lease-up deficits |
| Covered or enclosed boat/RV storage | Premium rents; service income | Slow premium-space absorption; seasonal nonrenewals | Canopy, roof, gate, and enclosed-space maintenance | Product mix, premium-rate retention, and remaining lease-up risk |
Separate weather- and activity-driven costs from relatively fixed costs, such as insurance and property taxes. Use local snow-removal invoices, utility bills for climate control and lighting, and maintenance records for gates, paved surfaces, and roofs. Also check whether a sale could change the tax assessment.
Recognize prepaid seasonal rent over the contract term, and keep refundable deposits separate from rental income. Use the resulting monthly NOI to build the stabilized value case.
Stabilized NOI and Value Scenarios
Once you’ve modeled monthly NOI, use it to estimate stabilized value and test exit sensitivity. Peak occupancy alone doesn’t support value. Performance must hold through the off-season.
Use stabilized value = annual stabilized NOI ÷ capitalization rate. This estimates value at stabilization - not today’s as-is value. Account for remaining capital needs, lease-up losses, and timing risk when moving from current to stabilized value. Model uneven interim cash flows rather than treating future income as available today.
Test monthly occupancy, effective rents after concessions and collection loss, and stabilized exit NOI together. Test capitalization rates separately to distinguish operating risk from valuation risk.
Count each cost once. If concessions or lease-up marketing already reduce modeled cash flow, don’t deduct them again as separate value adjustments. Keep capital expenditures separate from recurring operating expenses.
Transaction Advisory Support
Oakside Co supports self-storage and boat/RV underwriting through data-driven analysis, transaction management, and disposition support.
The final underwriting check for self-storage and boat/RV storage is whether seasonal performance holds up across the full cycle, accounting for market timing and lease-up pace. Perform a sensitivity analysis to test downside cases before setting value. Value should rest on lasting economic occupancy and collected NOI - not peak-season occupancy alone.
How can I distinguish seasonal vacancy from weak demand?
Underwrite on a monthly basis over 24–36 months, comparing occupancy and revenue quality across regions and unit types. Normal seasonal patterns include fewer discounts and concessions and firmer street rates during peak leasing: typically May–August for self-storage and the warmer months for boat/RV storage, where swings are sharper.
Watch for high physical occupancy that stays more than 10% above economic occupancy, or falling street rates paired with heavy discounting. These patterns can point to weak demand, lost pricing power, or collection problems.
How should I underwrite seasonality without historical data?
Use available facility data, focusing on economic occupancy rather than physical occupancy to account for concessions and delinquency. Compare pricing and occupancy trends at four to eight similar nearby facilities with regional seasonal patterns.
Track move-ins, street rates, and turnover by unit type. Heavy peak-season discounts or rates that don’t recover point to demand pressure - not just seasonal shifts. Stress-test your pro forma with a 6–12-month lease-up delay.
When does seasonal risk justify a lower purchase price?
Seasonal risk can justify a lower purchase price when weak leasing, heavy discounting, or below-peak street rates continue through the peak spring and summer months. These patterns may point to demand problems, not just normal seasonal shifts.
Nolen Masserman, Managing Director at Oakside, recommends using 24 to 36 months of data to separate recurring seasonal patterns from declining performance. Base the purchase price on realistic, long-term stabilized cash flow - not short-lived occupancy peaks.