

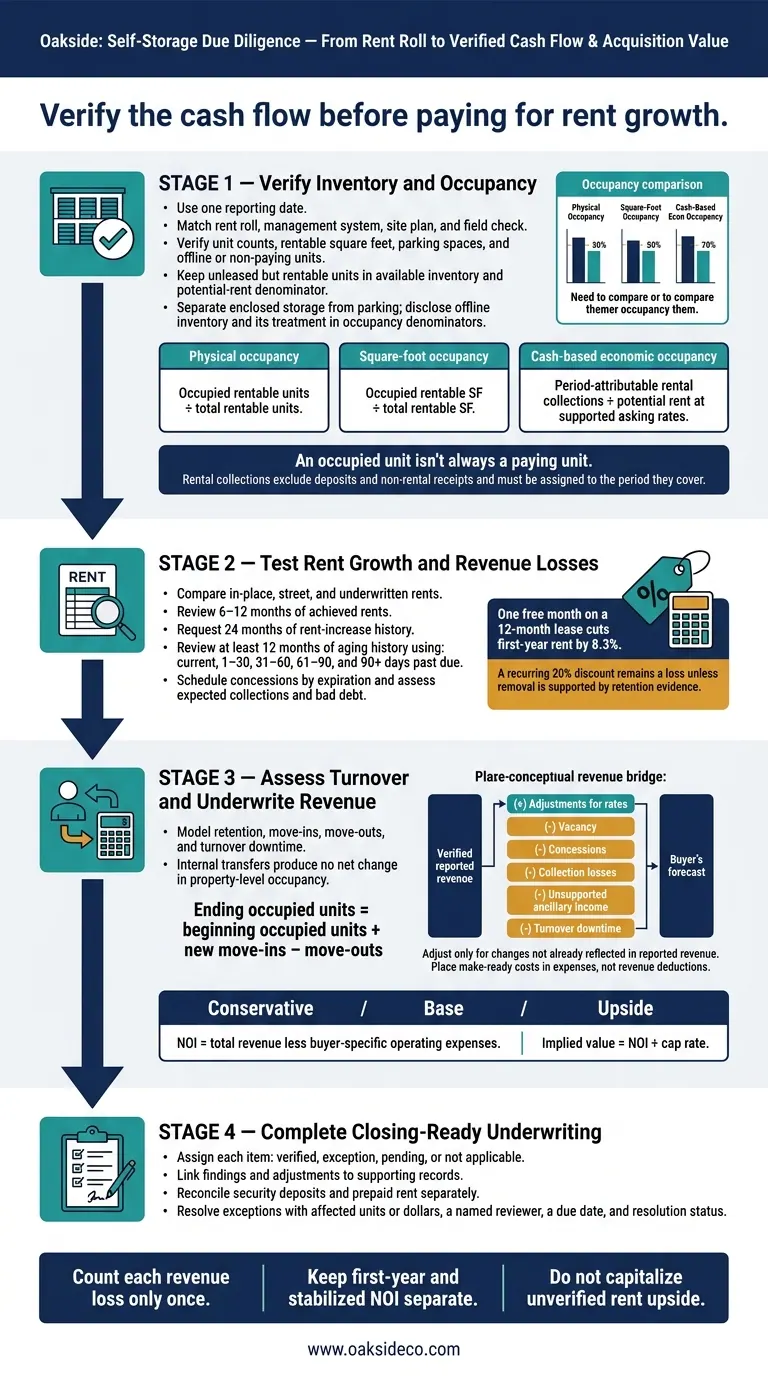
I base a self-storage acquisition on rent collected - not just units occupied. Before pricing a deal, I match the rent roll to the physical inventory, billed rent, and collections using one reporting date. One free month on a 12-month lease cuts first-year rent by 8.3%, so posted rates alone won’t tell you what you’re buying.
Here’s what I check:
- Inventory and occupancy: Unit counts, rentable square feet, parking spaces, and offline or non-paying units.
- Rent and losses: In-place rent versus achievable rates, rent increases, discounts, overdue balances, and bad debt.
- Tenant turnover: Length of stay, move-ins, move-outs, and downtime before units rent again.
- Revenue and price: Records that tie out, buyer-specific expenses, and downside, base, and upside forecasts.
- Closing adjustments: Deposits, prepaid rent, unresolved differences, and the records supporting each decision.
My rule: <u>verify the cash flow before paying for rent growth</u>. I keep first-year and stabilized NOI separate and count each revenue loss only once.
Self-Storage Rent Roll Review: From Inventory to Acquisition Value
Verify Required Rent Roll Fields
Request a unit-level export for a single reporting date. Then match unit counts across the rent roll, management system, site plan, and field check. Check duplicate IDs, combined units, incorrect dimensions, missing spaces, and units marked offline.
For every non-revenue unit, document why it produces no revenue, whether it can be rented, and how it factors into potential rent. Unleased but rentable units belong in available inventory and the potential-rent denominator. Show both reported and buyer-adjusted occupancy without removing units from the base.
| Required fields | Source document | Verification test | Underwriting use |
|---|---|---|---|
| Unit ID, building or location, dimensions, square feet, unit type, access | Unit inventory, site plan, management-system occupancy report | Match IDs and dimensions; confirm each unit physically exists | Establish rentable inventory and segments |
| Occupancy status, tenant name or tenant ID, move-in date, move-out activity | Tenant ledger, activity report | Match occupied units to tenant records | Verify occupancy and turnover |
| Monthly rent, street or asking rent, increase history | Rent roll, rate schedule, tenant ledger | Confirm current charges and effective dates | Test in-place revenue and rate assumptions |
| Concessions and expiration dates | Lease records, concession report | Check discounts against billed rent | Identify temporary revenue reductions |
| Balances and delinquency status | Accounts-receivable aging | Match balances and aging buckets | Flag collection risk |
| Security deposits and prepaid rent | Tenant ledger, general ledger | Separate advance payments from deposits | Prevent overstated rental collections |
Calculate Occupancy by Unit Type and Size
With inventory reconciled, break occupancy down by unit type and size. For enclosed storage, group units by size, climate control, and access. Separate drive-up units from interior or hallway-access units when the difference is material. Also separate outdoor, covered, and enclosed boat/RV storage and vehicle parking. Keep parking stalls separate when their area definitions differ from enclosed rentable square feet (SF).
Show total and occupied square feet alongside unit counts, and disclose offline units in both denominators. Calculate average monthly in-place rent by dividing total monthly in-place rent for occupied units by the number of occupied units. Calculate monthly rent per occupied square foot by dividing that same rent total by occupied rentable square feet.
| Schedule row | Inventory and occupancy columns | Rent and activity columns |
|---|---|---|
| Climate-controlled, by size and access | Total/occupied units; total/occupied SF; unit occupancy; SF occupancy; vacant units | Average monthly in-place rent; monthly rent per occupied SF; move-ins/move-outs |
| Non-climate-controlled, by size and access | Total/occupied units; total/occupied SF; unit occupancy; SF occupancy; vacant units | Average monthly in-place rent; monthly rent per occupied SF; move-ins/move-outs |
| Drive-up, by size and access | Total/occupied units; total/occupied SF; unit occupancy; SF occupancy; vacant units | Average monthly in-place rent; monthly rent per occupied SF; move-ins/move-outs |
| Interior or hallway-access, by size and access | Total/occupied units; total/occupied SF; unit occupancy; SF occupancy; vacant units | Average monthly in-place rent; monthly rent per occupied SF; move-ins/move-outs |
| Boat, RV, and vehicle parking, by coverage and stall size | Total/occupied spaces; space occupancy; vacant spaces; dimensions | Average monthly rent per occupied space; move-ins/move-outs |
Use separate subtotals for enclosed storage and parking. Track move-ins, move-outs, and net change over the last 30, 60, and 90 days. Keep temporarily offline inventory visible and show how it affects occupancy.
Compare Physical and Economic Occupancy
Once you've measured physical occupancy, check how much of it turns into rent.
An occupied unit isn't always a paying unit. Calculate cash-based economic occupancy using rental collections attributable to the review period. Exclude deposits and non-rental receipts. Remove collections for prior periods and prepayments for future periods, and assign previously collected prepaid rent to the period it covers.
Reconcile any differences from the operator's definition, including billed versus collected rent, asking rates, concessions, bad debt, delinquency, and offline inventory.
| Measure | Formula | Underwriting use |
|---|---|---|
| Physical occupancy | Occupied rentable units ÷ total rentable units | Measures unit utilization; disclose non-revenue occupancy |
| Square-foot occupancy | Occupied rentable SF ÷ total rentable SF | Shows whether vacancy is concentrated in larger units |
| Cash-based economic occupancy | Period-attributable rental collections ÷ potential rent at supported asking rates | Measures revenue realization after discounts and collection losses |
Compare In-Place, Street, and Underwritten Rents
Once inventory is verified, test whether in-place rent translates into lasting cash flow. Review executed leases, current availability, and 6–12 months of achieved rents - not just advertised rates. Underwritten rent should reflect what the property can sustain through tenant retention and replacement leasing, rather than the highest posted rate.
Build the comparison below for each rate class. Calculate the dollar gap as underwritten rent minus in-place rent and the percentage gap as (underwritten rent ÷ in-place rent) − 1. Use monthly underwritten rent to calculate rent per square foot. Flag zero-rent units separately because their percentage gap is undefined.
| Unit type | Occupancy | In-place rent | Street rent | Underwritten rent | Monthly rent per square foot | Tenant risk | Underwriting treatment | Dollar rent gap | Percentage rent gap |
|---|---|---|---|---|---|---|---|---|---|
| Climate-controlled, by size and floor | Rate-class occupancy | Average billed rent | Matching available rate | Supported achievable rate | Underwritten rent ÷ unit SF | Recent move-ins; above-market tenants | Phase increases using retention evidence | Underwritten − in-place | Underwritten ÷ in-place − 1 |
| Drive-up, by size | Rate-class occupancy | Average billed rent | Matching available rate | Rate supported by absorption | Underwritten rent ÷ unit SF | Vacancy; price sensitivity | Defer upside until absorption improves | Underwritten − in-place | Underwritten ÷ in-place − 1 |
| Zero-rent occupied units | Report separately | $0 | Matching available rate | Upside unverified | N/A until verified | Complimentary use; billing errors; promotions | Resolve status before recognizing growth | N/A until verified | N/A |
Review Rent Increases and Concession Expirations
Request 24 months of rent-increase history. Group tenants by move-in month, tenure, and last increase date. Record proposed increases, notice dates, effective dates, and move-outs after comparable past increases.
Before scheduling revenue, check agreement terms and state notice requirements. Deduct expected vacancy and re-leasing costs from the proceeds of rent increases.
Separately schedule free rent, promotions, recurring discounts, employee or manager discounts, and credits by cohort and expiration month. Measure concession load = concession dollars ÷ pre-concession scheduled rental charges.
One free month on a 12-month lease cuts first-year rent by 8.3%. A recurring 20% discount remains a loss unless removal is supported by retention evidence.
Reconcile Aging, Collections, and Bad Debt
Review at least 12 months of aging history, split into current, 1–30, 31–60, 61–90, and 90+ days past due buckets. Measure balances, affected units, cure rates, and collection timing for each bucket.
Trace material accounts to subsequent payments, payment plans, lien-sale proceeds, write-offs, recoveries, and the general ledger. Before assuming fast recovery, obtain state-specific rules for notices, cure periods, sale procedures, and proceeds.
| Revenue item | Supporting records | Persistence risk | Stabilized-NOI treatment |
|---|---|---|---|
| Scheduled rent | Rent roll; lease ledger; management-system charge report | Low to moderate; may include non-paying accounts or coding errors | Include only after validating occupancy, rates, and collectibility |
| Collected rent | Bank deposits; cash receipts; tenant ledgers; collection report | Lowest; represents realized cash subject to timing differences | Include as the strongest evidence of current revenue |
| Concessions | Discount ledger; promotion report; tenant contracts; credits | Temporary or persistent depending on terms | Deduct by expiration schedule and retain recurring discounts |
| Delinquency | Aging report; tenant ledgers; collection notes; lien records | May cure, roll forward, or become bad debt | Do not automatically deduct the full balance; estimate expected recovery and timing |
| Bad debt and write-offs | General ledger; write-off report; collection history; recovery report | Usually persistent for the written-off portion, but recoveries may occur | Deduct historical normalized loss after separating timing items and recoveries |
When separating stable rent from rollover risk for the revenue bridge in Step 3, assign each loss only once. The same balance should not reduce NOI twice.
After testing rent losses, assess turnover to see where revenue could still slip.
Measure Tenant Tenure and Turnover
Request current and historical monthly tenant-level exports covering at least 12 months, preferably 24–36 months. Include unit ID, unit type and size, move-in date, move-out date, current status, monthly rent, street rate, discounts, delinquency, payment status, and transfer history.
Report active tenants by tenure band, departed tenants by length of stay, and overlapping 3-, 6-, and 12-month arrival counts separately.
Track monthly move-ins, move-outs, and net move-ins - move-ins minus move-outs - by unit type and size. Calculate move-out rate = monthly move-outs ÷ beginning occupied units, using that denominator consistently. For annualized turnover, state whether the denominator is beginning occupied units or average occupied units.
Flag tenants paying above or below street rent, pending increases, expiring concessions, delinquency, and promotional cohorts. For tenants below street rent, model when increases can take effect and how much can be collected. Don’t assume the extra revenue starts immediately.
For each cohort, compare in-place rent, achievable street rent, concession-adjusted rent, collection rate, average tenure, and subsequent move-out rate. For boat and RV storage, compare monthly patterns across at least two full years where available. Separate seasonal vacancy from structural vacancy, and include marketing, administration, and unit-preparation costs in the turnover forecast.
Use management-system exports rather than retyped spreadsheets to preserve monthly occupancy and revenue history.
Reconcile Occupancy and Build the Revenue Bridge
Use those turnover cohorts to rebuild occupancy month by month:
Ending occupied units = beginning occupied units + new move-ins − move-outs.
Internal transfers produce no net change in property-level occupancy and do not represent new demand. Treat returned units as available inventory until they are re-leased. Reconcile the results with the rent roll and management reports, checking backdated activity, reservations, auctioned units, and management use.
Tie reported revenue to the T-12, A/R aging, general ledger, and bank and merchant deposits. Explain differences caused by processing fees, settlement delays, refunds, chargebacks, and transfers between accounts.
Then bridge verified reported revenue to the buyer’s forecast. Show separate adjustments for rates, vacancy, concessions, collection losses, unsupported ancillary income, and turnover downtime. Put make-ready costs in expenses. Adjust only for changes not already reflected in reported revenue, and label each adjustment recurring, nonrecurring, or buyer-specific.
Stress-Test NOI and Acquisition Value
Build conservative, base, and upside cases month by month before calculating annual totals. The assumptions below are illustrative inputs, not market benchmarks. Replace them with property-level evidence.
Occupancy must already account for modeled attrition and downtime. Calculate expenses using the buyer’s tax, insurance, staffing, management, marketing, and maintenance budgets - not just the seller’s historical costs. Convert turnover, downtime, and collection loss into monthly revenue before annualizing NOI.
| Assumption or output | Conservative | Base | Upside |
|---|---|---|---|
| Stabilized physical occupancy | 84% | 89% | 93% |
| Achievable annual rent growth | 0% | 3% | 5% |
| Concession burn-off | 25% realized over 24 months | 50% realized over 18 months | 75% realized over 12 months |
| Collection loss and bad debt, as % of gross potential rent | 4.0% | 2.5% | 1.5% |
| Annual tenant attrition | 30% | 24% | 20% |
| Average turnover downtime | 30 days | 20 days | 12 days |
| Rental revenue | Calculate from monthly unit-level assumptions | Calculate from monthly unit-level assumptions | Calculate from monthly unit-level assumptions |
| Recurring ancillary income | 3% of rental revenue | 5% | 6% |
| Total revenue | Rental revenue plus supported ancillary income | Rental revenue plus supported ancillary income | Rental revenue plus supported ancillary income |
| Buyer-specific operating expenses | 39% of total revenue | 35% | 33% |
| NOI | Total revenue less buyer-specific operating expenses | Total revenue less buyer-specific operating expenses | Total revenue less buyer-specific operating expenses |
| Cap rate | 7.25% | 6.75% | 6.50% |
| Implied value | NOI ÷ 7.25% | NOI ÷ 6.75% | NOI ÷ 6.50% |
Replace the illustrative assumptions with property-level evidence. Keep first-year and stabilized NOI separate, and do not capitalize unverified rent upside.
Turn the completed review’s verified unit-level data into closing-ready underwriting. Mark each checklist item as verified, exception, pending, or not applicable, and summarize the verified underwriting inputs. Confirm that projected revenue is backed by verified occupancy, rent, collections, and turnover. Link every finding to its supporting record.
Reconcile tenant balances separately. Tie security deposits and prepaid rent to tenant ledgers, the general ledger, bank records, and the closing statement. Specify which balances will transfer, be refunded, or receive credits at closing. Resolve questions about unapplied cash, duplicate deposits, and negative balances before approving the closing statement adjustment.
Include the scenario results and an approved adjustment schedule. For each change, record the amount, rationale, source document, and impact on the downside case. Clearly label the base, downside, upside, and stabilized results.
Before final underwriting approval, keep an exceptions log that identifies the affected units or dollars, a named reviewer, a due date, and resolution status. Don’t offset a material discrepancy with an unexplained adjustment. Correct it, quantify its price impact, or document a risk reserve.
Only items supported by the rent roll package should receive final approval. Final sign-off should confirm that projected revenue rests on verified rents, demonstrated collections, documented retention, and realistic concession and bad-debt assumptions - not occupancy alone.
Which rent roll red flags should make me reconsider a deal?
Reconsider a self-storage deal if physical and economic occupancy differ by more than 10%. Other warning signs include rents well below market, concessions that prop up effective occupancy, high delinquencies or aged receivables, delinquent units counted as occupied, and a spike in move-ins just before the sale.
Question NOI based on seller projections rather than verified rent-roll data and 24 months of occupancy history by unit type. Check reported income against deposits, too - even a discrepancy of about $20,000 can affect the property's value.
How can I tell if rent increases will trigger move-outs?
Compare in-place rents with current street rates and past churn, looking at occupancy by unit type - not just facility averages. Even when occupancy is high, falling street rates may warn that steep rent increases could push tenants to move out.
Check turnover outside normal move-out periods, the amount of concessions offered, and how fast new tenants move in. Unusual churn may point to oversupply or weak tenant retention. Heavy discounts used to keep units occupied suggest limited pricing power and a greater risk of move-outs if rents increase further.
How should unresolved rent roll discrepancies affect my offer?
Treat unresolved rent roll discrepancies as red flags that affect your valuation and offer price. Even small income errors can turn into large losses once valuation multiples are applied. Check all data against bank statements, merchant processing reports, and management software exports.
If the numbers still don’t match, the risk of running the property may warrant a lower offer, a higher cap rate, or a pause for deeper due diligence.